Matplotlib示例
Matplotlib是一个用于Python的数据可视化库,可以用来创建各种图表,包括线图、柱状图、散点图等等。本文将介绍一些常见的Matplotlib示例,帮助你快速上手使用这个强大的库。
安装Matplotlib
在开始之前,首先需要安装Matplotlib库。你可以使用pip来安装Matplotlib:
pip install matplotlib
安装完成后,就可以开始使用Matplotlib了。
绘制简单的线图
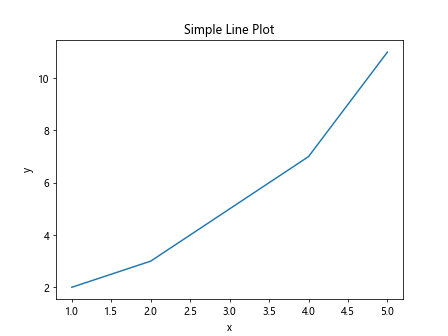
首先,我们来看一个绘制简单线图的示例代码:
import matplotlib.pyplot as plt

x = [1, 2, 3, 4, 5]
y = [2, 3, 5, 7, 11]

plt.plot(x, y)
plt.xlabel('x')
plt.ylabel('y')
plt.title('Simple Line Plot')
plt.show()
Output:
绘制多个子图
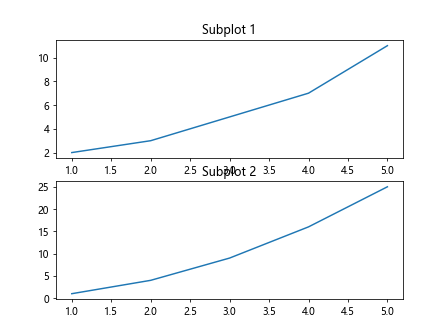
接着,我们来看一个绘制包含多个子图的示例代码:
import matplotlib.pyplot as plt

x = [1, 2, 3, 4, 5]
y1 = [2, 3, 5, 7, 11]
y2 = [1, 4, 9, 16, 25]

plt.subplot(2, 1, 1)
plt.plot(x, y1)
plt.title('Subplot 1')

plt.subplot(2, 1, 2)
plt.plot(x, y2)
plt.title('Subplot 2')

plt.show()
Output:
绘制柱状图
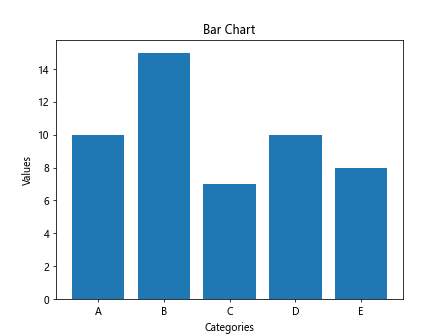
下面是一个绘制简单柱状图的示例代码:
import matplotlib.pyplot as plt

categories = ['A', 'B', 'C', 'D', 'E']
values = [10, 15, 7, 10, 8]

plt.bar(categories, values)
plt.xlabel('Categories')
plt.ylabel('Values')
plt.title('Bar Chart')
plt.show()
Output:
绘制散点图
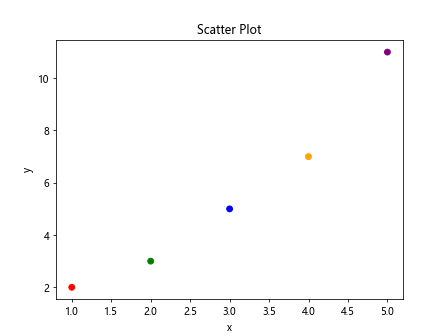
接下来是一个用于生成散点图的示例代码:
import matplotlib.pyplot as plt

x = [1, 2, 3, 4, 5]
y = [2, 3, 5, 7, 11]
colors = ['red', 'green', 'blue', 'orange', 'purple']

plt.scatter(x, y, c=colors)
plt.xlabel('x')
plt.ylabel('y')
plt.title('Scatter Plot')
plt.show()
Output:
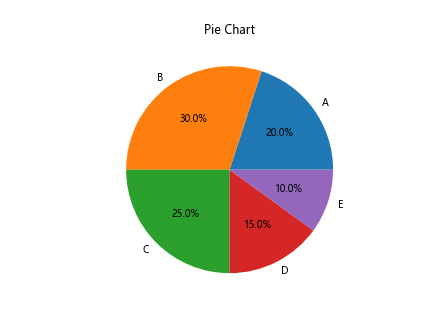
绘制饼图
下面是一个绘制饼图的示例代码:
import matplotlib.pyplot as plt

sizes = [20, 30, 25, 15, 10]
labels = ['A', 'B', 'C', 'D', 'E']

plt.pie(sizes, labels=labels, autopct='%1.1f%%')
plt.title('Pie Chart')
plt.show()
Output:
绘制直方图
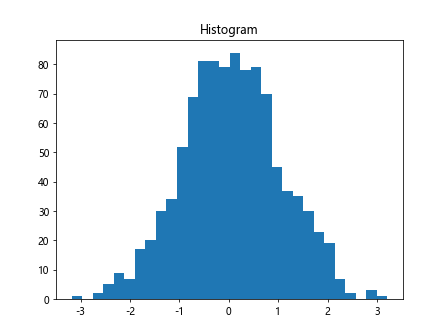
接下来是一个绘制直方图的示例代码:
import matplotlib.pyplot as plt
import numpy as np

data = np.random.normal(0, 1, 1000)

plt.hist(data, bins=30)
plt.title('Histogram')
plt.show()
Output:
添加图例
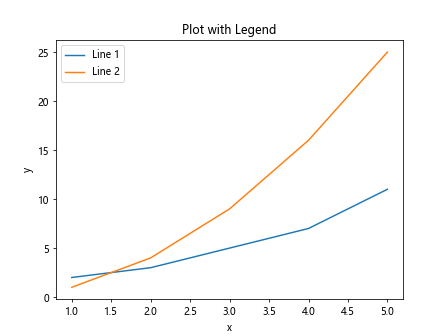
下面是一个添加图例的示例代码:
import matplotlib.pyplot as plt

x = [1, 2, 3, 4, 5]
y1 = [2, 3, 5, 7, 11]
y2 = [1, 4, 9, 16, 25]

plt.plot(x, y1, label='Line 1')
plt.plot(x, y2, label='Line 2')
plt.xlabel('x')
plt.ylabel('y')
plt.title('Plot with Legend')
plt.legend()
plt.show()
Output:
改变图表样式
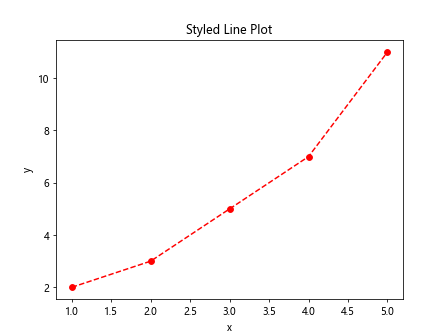
以下是一个改变图表样式的示例代码:
import matplotlib.pyplot as plt

x = [1, 2, 3, 4, 5]
y = [2, 3, 5, 7, 11]

plt.plot(x, y, linestyle='--', marker='o', color='red')
plt.xlabel('x')
plt.ylabel('y')
plt.title('Styled Line Plot')
plt.show()
Output:
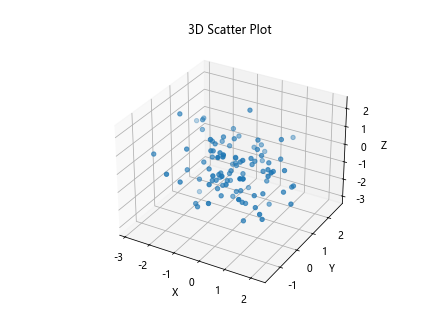
绘制3D图
接下来是一个绘制3D图的示例代码:
import matplotlib.pyplot as plt
from mpl_toolkits.mplot3d import Axes3D
import numpy as np

fig = plt.figure()
ax = fig.add_subplot(111, projection='3d')

x = np.random.standard_normal(100)
y = np.random.standard_normal(100)
z = np.random.standard_normal(100)

ax.scatter(x, y, z)
ax.set_xlabel('X')
ax.set_ylabel('Y')
ax.set_zlabel('Z')

plt.title('3D Scatter Plot')
plt.show()
Output:
添加标注
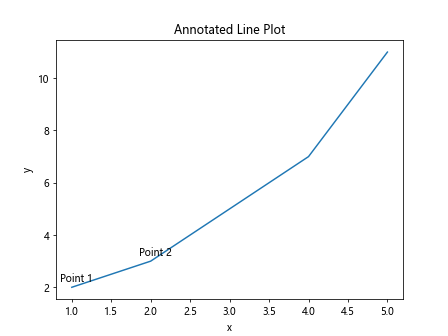
下面是一个在图表中添加标注的示例代码:
import matplotlib.pyplot as plt

x = [1, 2, 3, 4, 5]
y = [2, 3, 5, 7, 11]

plt.plot(x, y)
plt.annotate('Point 1', (1, 2), textcoords='offset points', xytext=(5,5), ha='center')
plt.annotate('Point 2', (2, 3), textcoords='offset points', xytext=(5,5), ha='center')
plt.xlabel('x')
plt.ylabel('y')
plt.title('Annotated Line Plot')
plt.show()
Output:
自定义坐标轴范围
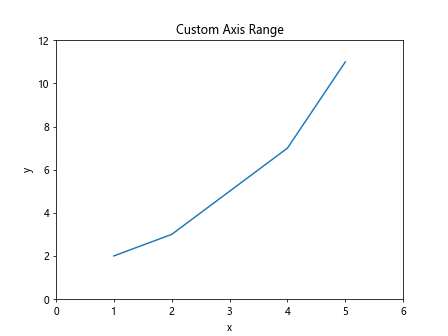
接下来是一个自定义坐标轴范围的示例代码:
import matplotlib.pyplot as plt

x = [1, 2, 3, 4, 5]
y = [2, 3, 5, 7, 11]

plt.plot(x, y)
plt.xlim(0, 6)
plt.ylim(0, 12)
plt.xlabel('x')
plt.ylabel('y')
plt.title('Custom Axis Range')
plt.show()
Output:
设置图表尺寸
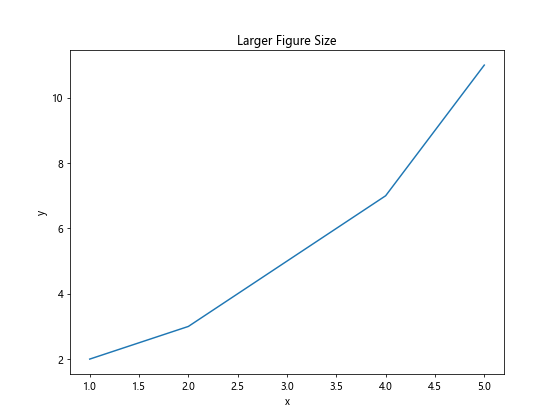
以下是一个设置图表尺寸的示例代码:
import matplotlib.pyplot as plt

x = [1, 2, 3, 4, 5]
y = [2, 3, 5, 7, 11]

plt.figure(figsize=(8, 6))
plt.plot(x, y)
plt.xlabel('x')
plt.ylabel('y')
plt.title('Larger Figure Size')
plt.show()
Output:
使用不同颜色和标记
接下来是一个使用不同颜色和标记的示例代码:
import matplotlib.pyplot as plt

x = [1, 2, 3, 4, 5]
y = [2, 3, 5, 7, 11]

plt.plot(x, y, color='green', marker='s')
plt.xlabel('x')
plt.ylabel('y')
plt.title('Custom Color and Marker')
plt.show()
Output:

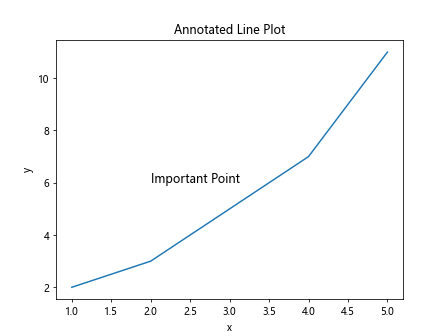
添加注释
下面是一个在图表中添加注释的示例代码:
import matplotlib.pyplot as plt

x = [1, 2, 3, 4, 5]
y = [2, 3, 5, 7, 11]

plt.plot(x, y)
plt.text(2, 6, 'Important Point', fontsize=12)
plt.xlabel('x')
plt.ylabel('y')
plt.title('Annotated Line Plot')
plt.show()
Output:
使用subplot2grid创建复杂布局
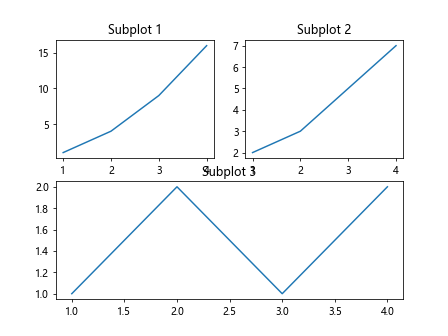
接下来是一个使用subplot2grid创建复杂布局的示例代码:
import matplotlib.pyplot as plt

plt.subplot2grid((2,2), (0,0))
plt.plot([1, 2, 3, 4], [1, 4, 9, 16])
plt.title('Subplot 1')

plt.subplot2grid((2,2), (0,1))
plt.plot([1, 2, 3, 4], [2, 3, 5, 7])
plt.title('Subplot 2')

plt.subplot2grid((2,2), (1,0), colspan=2)
plt.plot([1, 2, 3, 4], [1, 2, 1, 2])
plt.title('Subplot 3')

plt.show()
Output:
使用已有数据绘制图表
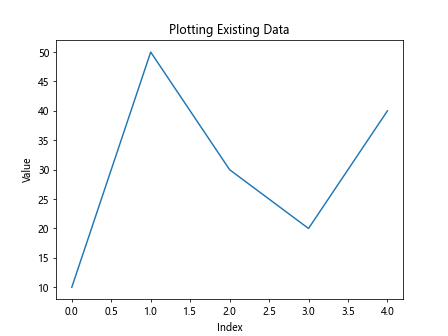
下面是一个使用已有数据绘制图表的示例代码:
import matplotlib.pyplot as plt

data = [10, 50, 30, 20, 40]
plt.plot(data)
plt.xlabel('Index')
plt.ylabel('Value')
plt.title('Plotting Existing Data')
plt.show()
Output:
 极客教程
极客教程