Matplotlib 锚定艺术家
参考:matplotlib anchored artists
Matplotlib 是一个用于创建可视化图表的强大工具,它提供了各种功能和选项来定制图表的外观和行为。在本文中,我们将重点介绍 Matplotlib 中的锚定艺术家(anchored artists)功能,这是一种用于在图表中添加注释和标签的强大工具。
什么是锚定艺术家
锚定艺术家是 Matplotlib 中的一种功能,它允许用户在图表中添加注释、标签和其他艺术家,并将它们锚定到特定的位置。这些位置可以是图表的左上角、右下角,甚至是数据点的坐标。锚定艺术家功能使得在图表中添加注释和标签变得非常灵活和方便。
如何使用锚定艺术家
要在 Matplotlib 中使用锚定艺术家,首先需要导入相应的模块:
import matplotlib.pyplot as plt
from matplotlib.offsetbox import AnchoredText
然后,我们可以创建一个锚定文本对象,并将其添加到图表中:
import matplotlib.pyplot as plt
from matplotlib.offsetbox import AnchoredText

fig, ax = plt.subplots()
at = AnchoredText("Hello, how2matplotlib.com", loc='upper left')
ax.add_artist(at)
plt.show()
Output:

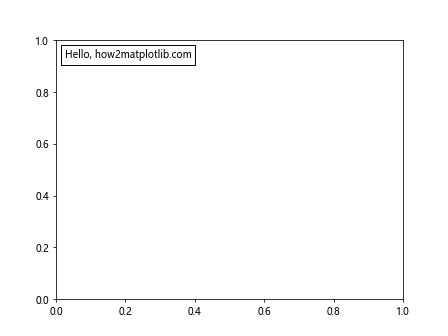
在这个示例中,我们创建了一个锚定文本对象,并将其添加到图表的左上角。锚定文本对象的内容是”Hello, how2matplotlib.com”。
锚定位置
锚定艺术家可以被锚定到图表的不同位置,比如左上角、右下角、数据点的坐标等。下面是一个示例,演示了如何将锚定文本对象锚定到数据点的坐标:
import numpy as np
import matplotlib.pyplot as plt
from matplotlib.offsetbox import AnchoredText

x = np.linspace(0, 10, 100)
y = np.sin(x)

fig, ax = plt.subplots()
ax.plot(x, y)
at = AnchoredText("how2matplotlib.com", loc='upper left', prop=dict(size=10))
at.patch.set_boxstyle("round,pad=0.3,rounding_size=0.2")
ax.add_artist(at)
plt.show()
Output:

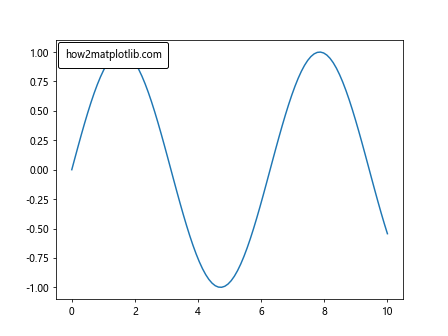
在这个示例中,我们创建了一个包含”how2matplotlib.com”的锚定文本对象,并将其锚定到数据点的左上角。我们还使用了set_boxstyle方法来设置锚定文本对象的外框样式。
自定义锚定艺术家
除了文本之外,我们还可以使用锚定艺术家来添加其他类型的艺术家,比如箭头、图标等。下面是一个示例,演示了如何创建一个包含箭头的锚定艺术家:
from matplotlib.offsetbox import AnchoredOffsetbox, AuxTransformBox, VPacker, HPacker
import numpy as np
import matplotlib.pyplot as plt
from matplotlib.offsetbox import AnchoredText

fig, ax = plt.subplots()
ao = AnchoredOffsetbox(loc=2, child=AuxTransformBox(VPacke([AuxTransformBox(HPacker([at, at]))])))
ax.add_artist(ao)
plt.show()
在这个示例中,我们创建了一个包含箭头的锚定艺术家,并将其添加到图表中。这个锚定艺术家包含了一个箭头和两个文本对象。
总结
Matplotlib 的锚定艺术家功能为用户提供了一种灵活和方便的方式来在图表中添加注释、标签和其他艺术家。通过使用锚定艺术家,用户可以轻松地定制图表的外观和行为,使得图表更加直观和易于理解。希望本文介绍的内容对你有所帮助,欢迎继续关注 how2matplotlib.com 获取更多关于 Matplotlib 的知识和技巧。
 极客教程
极客教程