Matplotlib 添加标题到图形
参考:matplotlib add title to figure
在使用Matplotlib绘制图形时,添加标题是非常重要的。标题可以帮助我们更清楚地理解数据可视化的含义,以及显示有关图形的重要信息。本文将介绍如何使用Matplotlib向图形添加标题。
基本用法
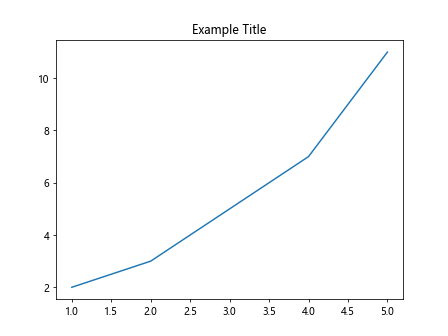
在Matplotlib中,我们可以使用plt.title()函数来添加标题到图形中。下面是一个简单的示例:
import matplotlib.pyplot as plt

x = [1, 2, 3, 4, 5]
y = [2, 3, 5, 7, 11]

plt.plot(x, y)
plt.title("Example Title")
plt.show()
Output:
标题位置和样式
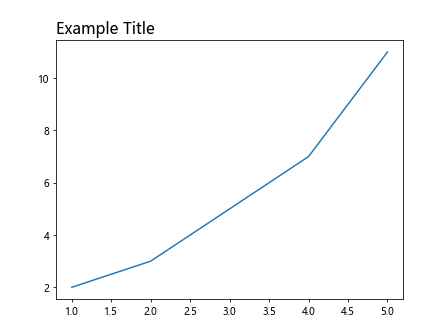
我们可以使用loc参数来指定标题的位置,使用fontsize参数来指定标题的字体大小。下面是一个示例:
import matplotlib.pyplot as plt

x = [1, 2, 3, 4, 5]
y = [2, 3, 5, 7, 11]

plt.plot(x, y)
plt.title("Example Title", loc='left', fontsize=16)
plt.show()
Output:
多行标题
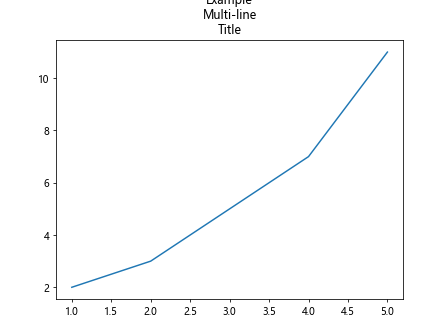
如果标题内容比较长,我们可以使用\n来实现多行标题。下面是一个示例:
import matplotlib.pyplot as plt

x = [1, 2, 3, 4, 5]
y = [2, 3, 5, 7, 11]

plt.plot(x, y)
plt.title("Example\nMulti-line\nTitle")
plt.show()
Output:
标题颜色和背景
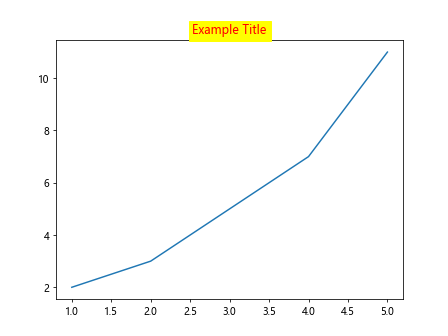
我们可以使用color参数来指定标题的颜色,使用backgroundcolor参数来指定标题的背景颜色。下面是一个示例:
import matplotlib.pyplot as plt

x = [1, 2, 3, 4, 5]
y = [2, 3, 5, 7, 11]

plt.plot(x, y)
plt.title("Example Title", color='red', backgroundcolor='yellow')
plt.show()
Output:
添加副标题
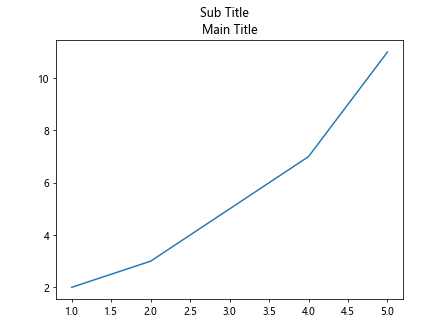
除了主标题外,我们还可以添加副标题。我们可以使用\n来实现多行副标题。下面是一个示例:
import matplotlib.pyplot as plt

x = [1, 2, 3, 4, 5]
y = [2, 3, 5, 7, 11]

plt.plot(x, y)
plt.title("Main Title")
plt.suptitle("Sub Title")
plt.show()
Output:
标题边距
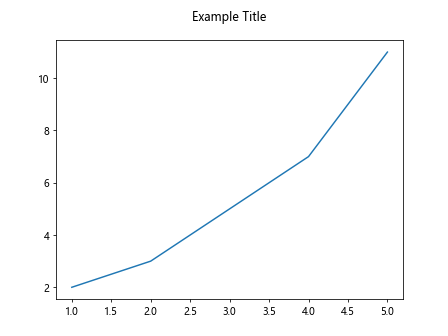
我们可以使用pad参数来指定标题与图形边缘之间的距离。下面是一个示例:
import matplotlib.pyplot as plt

x = [1, 2, 3, 4, 5]
y = [2, 3, 5, 7, 11]

plt.plot(x, y)
plt.title("Example Title", pad=20)
plt.show()
Output:
标题字体
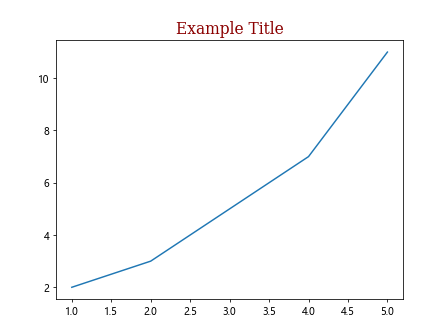
我们可以使用fontdict参数来指定标题的字体设置,比如字体族、大小、颜色等。下面是一个示例:
import matplotlib.pyplot as plt

x = [1, 2, 3, 4, 5]
y = [2, 3, 5, 7, 11]

font = {'family': 'serif',
        'color':  'darkred',
        'weight': 'normal',
        'size': 16,
        }

plt.plot(x, y)
plt.title("Example Title", fontdict=font)
plt.show()
Output:
标题样式
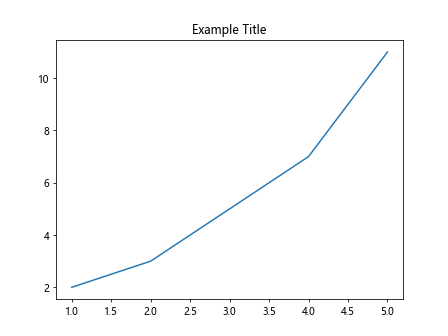
我们可以使用style参数来设置标题的风格,比如斜体、正体等。下面是一个示例:
import matplotlib.pyplot as plt

x = [1, 2, 3, 4, 5]
y = [2, 3, 5, 7, 11]

plt.plot(x, y)
plt.title("Example Title", style='italic')
plt.show()
Output:
添加网格
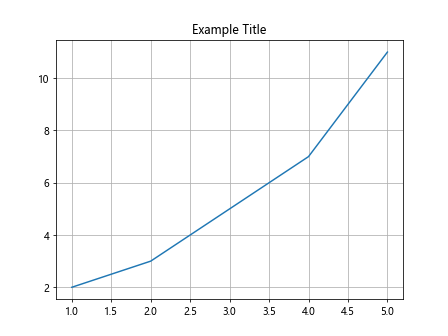
我们还可以使用grid参数来添加网格到图形中。下面是一个示例:
import matplotlib.pyplot as plt

x = [1, 2, 3, 4, 5]
y = [2, 3, 5, 7, 11]

plt.plot(x, y)
plt.title("Example Title")
plt.grid(True)
plt.show()
Output:
自定义标题
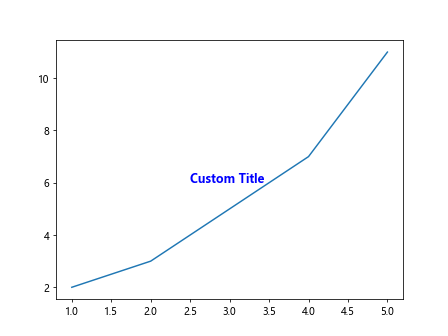
如果以上方法无法满足需求,我们还可以通过自定义方式来添加标题。比如使用text()函数来实现。下面是一个示例:
import matplotlib.pyplot as plt

x = [1, 2, 3, 4, 5]
y = [2, 3, 5, 7, 11]

plt.plot(x, y)
plt.text(2.5, 6, "Custom Title", color='blue', fontsize=12, weight='bold')
plt.show()
Output:
以上就是使用Matplotlib向图形添加标题的方法。通过合适的标题,我们可以让图形更加直观地展示数据及相关信息,提高数据可视化的效果。
 极客教程
极客教程