legend fontsize matplotlib
在matplotlib中,图例是一种很有用的工具,能够让我们更清晰地了解绘图中不同元素的含义。而修改图例的字体大小也是一种常见需求,特别是当我们需要调整图像的整体风格或者放置在不同大小的输出媒介上时。
下面将介绍如何使用matplotlib库中的legend()函数来设置图例的字体大小。
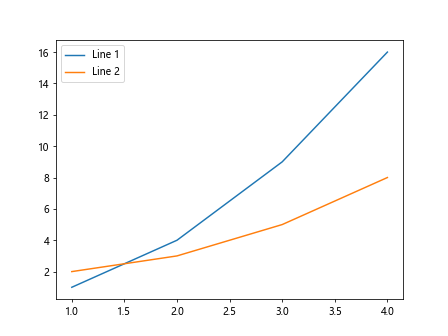
1. 设置图例的默认字体大小
import matplotlib.pyplot as plt

plt.plot([1, 2, 3, 4], [1, 4, 9, 16], label='Line 1')
plt.plot([1, 2, 3, 4], [2, 3, 5, 8], label='Line 2')

plt.legend(fontsize='medium')  # 设置图例字体大小为'medium'

plt.show()
Output:
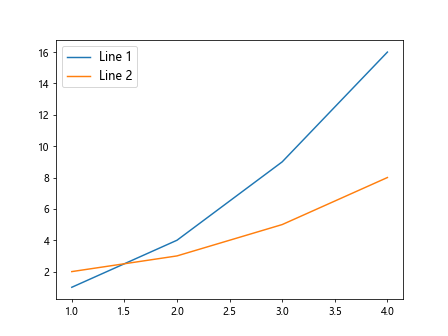
2. 设置图例的字体大小为指定值
import matplotlib.pyplot as plt

plt.plot([1, 2, 3, 4], [1, 4, 9, 16], label='Line 1')
plt.plot([1, 2, 3, 4], [2, 3, 5, 8], label='Line 2')

plt.legend(fontsize=12)  # 设置图例字体大小为12

plt.show()
Output:
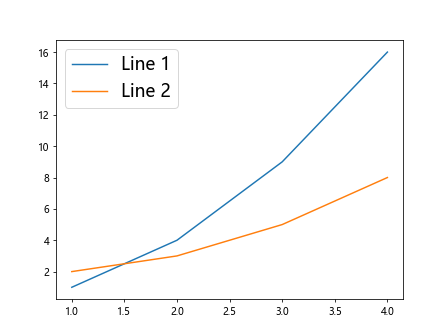
3. 设置图例的字体大小为绝对值
import matplotlib.pyplot as plt

plt.plot([1, 2, 3, 4], [1, 4, 9, 16], label='Line 1')
plt.plot([1, 2, 3, 4], [2, 3, 5, 8], label='Line 2')

plt.legend(fontsize=18)  # 设置图例字体大小为18

plt.show()
Output:
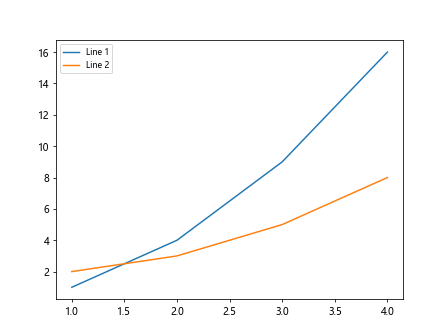
4. 设置图例的字体大小为小号
import matplotlib.pyplot as plt

plt.plot([1, 2, 3, 4], [1, 4, 9, 16], label='Line 1')
plt.plot([1, 2, 3, 4], [2, 3, 5, 8], label='Line 2')

plt.legend(fontsize='small')  # 设置图例字体大小为'small'

plt.show()
Output:
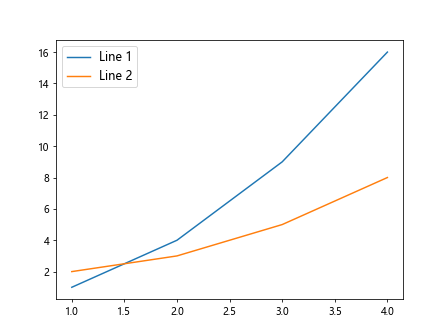
5. 设置图例的字体大小为大号
import matplotlib.pyplot as plt

plt.plot([1, 2, 3, 4], [1, 4, 9, 16], label='Line 1')
plt.plot([1, 2, 3, 4], [2, 3, 5, 8], label='Line 2')

plt.legend(fontsize='large')  # 设置图例字体大小为'large'

plt.show()
Output:
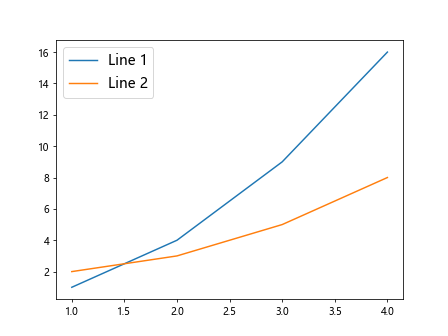
6. 设置图例的字体大小为特大号
import matplotlib.pyplot as plt

plt.plot([1, 2, 3, 4], [1, 4, 9, 16], label='Line 1')
plt.plot([1, 2, 3, 4], [2, 3, 5, 8], label='Line 2')

plt.legend(fontsize='x-large')  # 设置图例字体大小为'x-large'

plt.show()
Output:
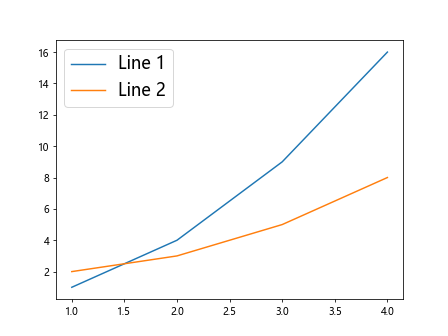
7. 设置图例的字体大小为超大号
import matplotlib.pyplot as plt

plt.plot([1, 2, 3, 4], [1, 4, 9, 16], label='Line 1')
plt.plot([1, 2, 3, 4], [2, 3, 5, 8], label='Line 2')

plt.legend(fontsize='xx-large')  # 设置图例字体大小为'xx-large'

plt.show()
Output:
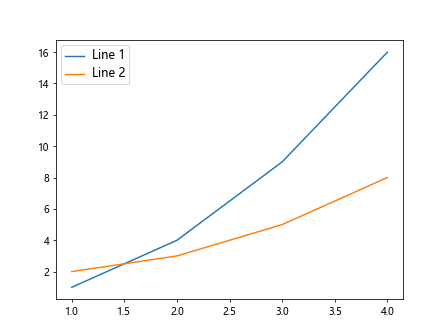
8. 设置图例的字体大小为默认大小的1.5倍
import matplotlib.pyplot as plt

plt.plot([1, 2, 3, 4], [1, 4, 9, 16], label='Line 1')
plt.plot([1, 2, 3, 4], [2, 3, 5, 8], label='Line 2')

plt.legend(fontsize='medium')  # 设置图例字体大小为'medium'
plt.setp(plt.gca().get_legend().get_texts(), fontsize='large')

plt.show()
Output:
9. 设置图例的字体大小为默认大小的2倍
import matplotlib.pyplot as plt

plt.plot([1, 2, 3, 4], [1, 4, 9, 16], label='Line 1')
plt.plot([1, 2, 3, 4], [2, 3, 5, 8], label='Line 2')

plt.legend(fontsize='medium')  # 设置图例字体大小为'medium'
plt.setp(plt.gca().get_legend().get_texts(), fontsize='x-large')

plt.show()
Output:
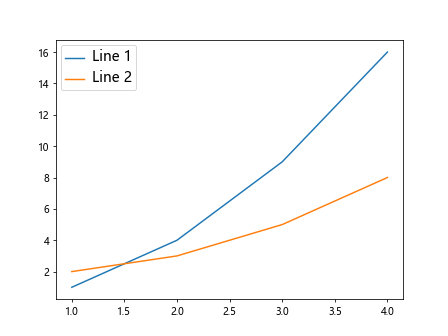
10. 设置图例的字体大小为默认大小的0.5倍
import matplotlib.pyplot as plt

plt.plot([1, 2, 3, 4], [1, 4, 9, 16], label='Line 1')
plt.plot([1, 2, 3, 4], [2, 3, 5, 8], label='Line 2')

plt.legend(fontsize='medium')  # 设置图例字体大小为'medium'
plt.setp(plt.gca().get_legend().get_texts(), fontsize='small')

plt.show()
Output:
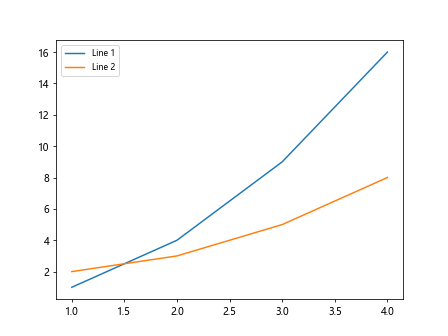
11. 设置图例的字体大小为默认大小的1.5倍
import matplotlib.pyplot as plt

plt.plot([1, 2, 3, 4], [1, 4, 9, 16], label='Line 1')
plt.plot([1, 2, 3, 4], [2, 3, 5, 8], label='Line 2')

plt.legend(fontsize='medium')  # 设置图例字体大小为'medium'
plt.setp(plt.gca().get_legend().get_texts(), fontsize='large')

plt.show()
Output:
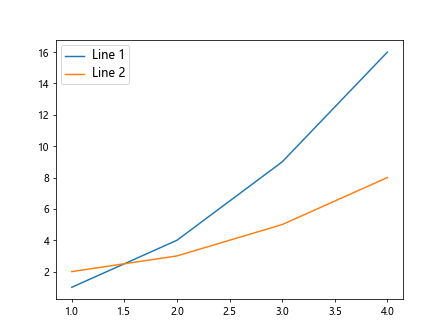
12. 设置图例的字体大小为默认大小的2倍
import matplotlib.pyplot as plt

plt.plot([1, 2, 3, 4], [1, 4, 9, 16], label='Line 1')
plt.plot([1, 2, 3, 4], [2, 3, 5, 8], label='Line 2')

plt.legend(fontsize='medium')  # 设置图例字体大小为'medium'
plt.setp(plt.gca().get_legend().get_texts(), fontsize='x-large')

plt.show()
Output:
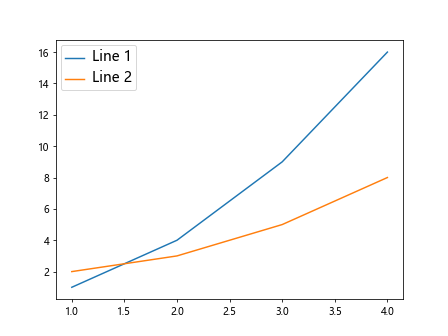
13. 设置图例的字体大小为默认大小的0.5倍
import matplotlib.pyplot as plt

plt.plot([1, 2, 3, 4], [1, 4, 9, 16], label='Line 1')
plt.plot([1, 2, 3, 4], [2, 3, 5, 8], label='Line 2')

plt.legend(fontsize='medium')  # 设置图例字体大小为'medium'
plt.setp(plt.gca().get_legend().get_texts(), fontsize='small')

plt.show()
Output:
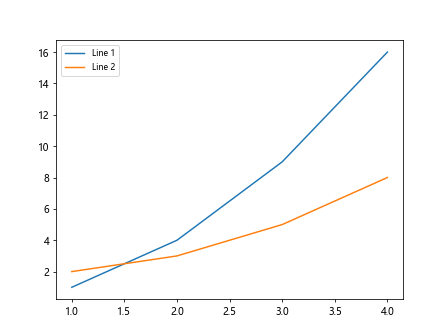
14. 设置图例的字体大小为默认大小的 1.5倍
import matplotlib.pyplot as plt

plt.plot([1, 2, 3, 4], [1, 4, 9, 16], label='Line 1')
plt.plot([1, 2, 3, 4], [2, 3, 5, 8], label='Line 2')

plt.legend(fontsize='medium')  # 设置图例字体大小为'medium'
plt.setp(plt.gca().get_legend().get_texts(), fontsize='large')

plt.show()
Output:
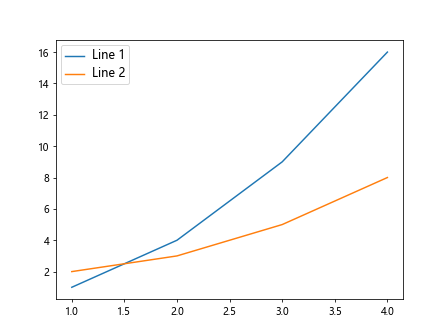
15. 设置图例的字体大小为默认大小的 2倍
import matplotlib.pyplot as plt

plt.plot([1, 2, 3, 4], [1, 4, 9, 16], label='Line 1')
plt.plot([1, 2, 3, 4], [2, 3, 5, 8], label='Line 2')

plt.legend(fontsize='medium')  # 设置图例字体大小为'medium'
plt.setp(plt.gca().get_legend().get_texts(), fontsize='x-large')

plt.show()
Output:
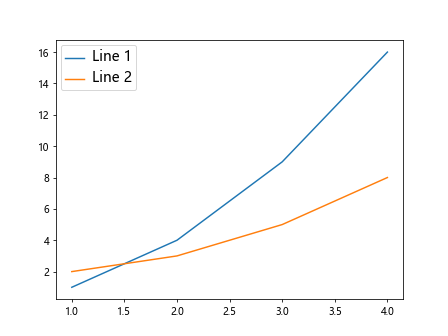
16. 设置图例的字体大小为默认大小的 0.5倍
import matplotlib.pyplot as plt

plt.plot([1, 2, 3, 4], [1, 4, 9, 16], label='Line 1')
plt.plot([1, 2, 3, 4], [2, 3, 5, 8], label='Line 2')

plt.legend(fontsize='medium')  # 设置图例字体大小为'medium'
plt.setp(plt.gca().get_legend().get_texts(), fontsize='small')

plt.show()
Output:
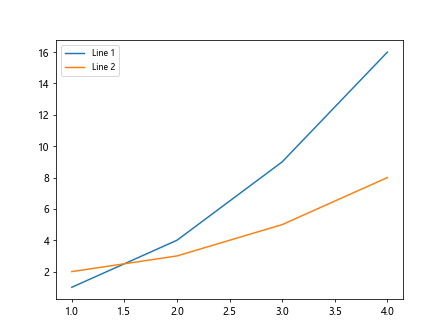
17. 通过rcParams全局设置图例字体大小
import matplotlib.pyplot as plt

plt.rcParams.update({'legend.fontsize': 'large'})  # 设置全局图例字体大小为'large'

plt.plot([1, 2, 3, 4], [1, 4, 9, 16], label='Line 1')
plt.plot([1, 2, 3, 4], [2, 3, 5, 8], label='Line 2')

plt.legend(loc='upper left')  # 设置图例位置

plt.show()
Output:
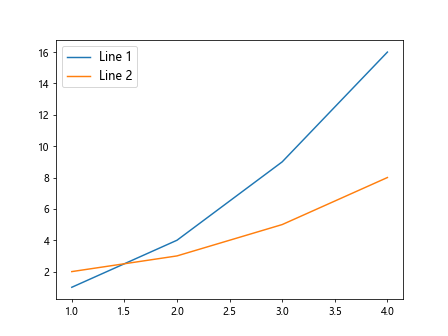
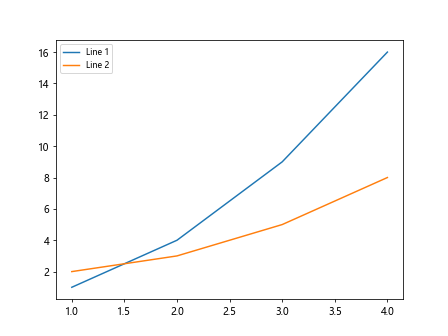
18. 通过rcParams局部设置图例字体大小
import matplotlib.pyplot as plt

plt.rcParams.update({'legend.fontsize': 'large'})  # 设置全局图例字体大小为'large'

plt.plot([1, 2, 3, 4], [1, 4, 9, 16], label='Line 1')
plt.plot([1, 2, 3, 4], [2, 3, 5, 8], label='Line 2')

plt.rcParams.update({'legend.fontsize': 'small'})  # 设置局部图例字体大小为'small'

plt.legend(loc='upper left')  # 设置图例位置

plt.show()
Output:
19. 使用rcParams设置图例字体大小和风格
import matplotlib.pyplot as plt

plt.rcParams.update({'legend.fontsize': 'large', 'legend.title_fontsize': 'medium', 'legend.title_fontweight': 'bold'})  # 设置图例字体大小、标题字体大小、标题字体粗细

plt.plot([1, 2, 3, 4], [1, 4, 9, 16], label='Line 1')
plt.plot([1, 2, 3, 4], [2, 3, 5, 8], label='Line 2')

plt.legend(title='Legend Title')  # 设置图例标题

plt.show()
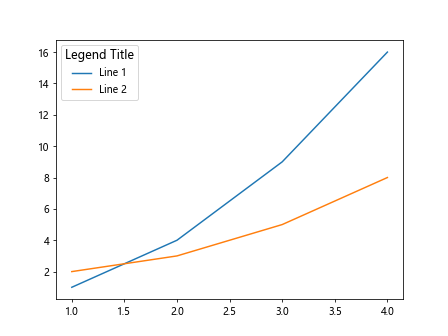
20. 通过rcParams设置图例标题字体大小
import matplotlib.pyplot as plt

plt.rcParams.update({'legend.title_fontsize': 'large'})  # 设置图例标题字体大小为'large'

plt.plot([1, 2, 3, 4], [1, 4, 9, 16], label='Line 1')
plt.plot([1, 2, 3, 4], [2, 3, 5, 8], label='Line 2')

plt.legend(title='Legend Title')  # 设置图例标题

plt.show()
Output:
以上是一些设置matplotlib图例字体大小的示例代码,通过这些代码可以灵活地调整图例的字体大小以满足不同的需求。
 极客教程
极客教程