如何在matplotlib中拉伸x轴
参考:how to stretch x axis in matplotlib
在matplotlib中,我们经常需要调整图表的显示效果,包括调整坐标轴的范围和比例。本文将介绍如何在matplotlib中拉伸x轴,使得图表更加清晰和易于理解。
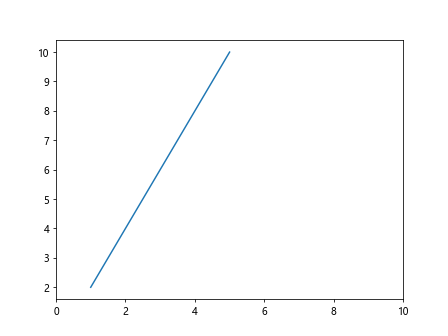
方法一:使用xlim函数
import matplotlib.pyplot as plt

x = [1, 2, 3, 4, 5]
y = [2, 4, 6, 8, 10]

plt.plot(x, y)
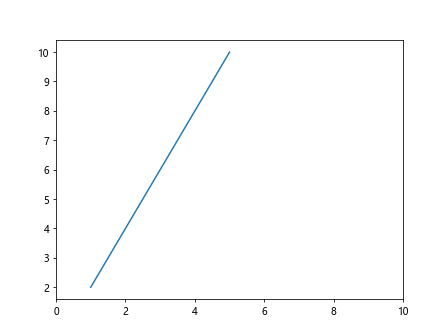
plt.xlim(0, 10) # 拉伸x轴范围至0到10
plt.show()
Output:
方法二:调整图表大小
import matplotlib.pyplot as plt

x = [1, 2, 3, 4, 5]
y = [2, 4, 6, 8, 10]

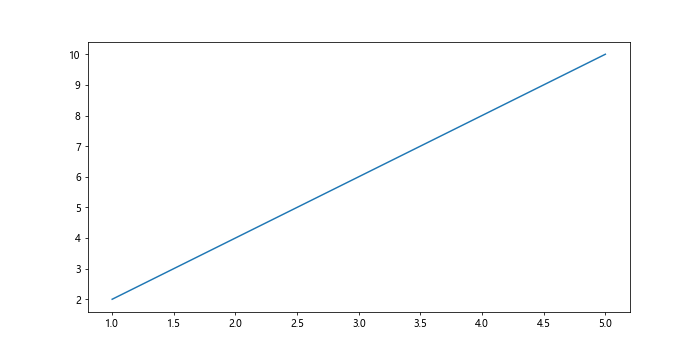
plt.figure(figsize=(10, 5)) # 调整图表大小为10x5
plt.plot(x, y)
plt.show()
Output:
方法三:使用set_xlim函数
import matplotlib.pyplot as plt

x = [1, 2, 3, 4, 5]
y = [2, 4, 6, 8, 10]

plt.plot(x, y)
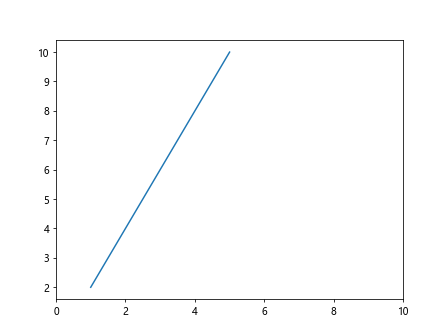
plt.gca().set_xlim([0, 10]) # 使用set_xlim函数拉伸x轴范围至0到10
plt.show()
Output:
方法四:使用subplot函数
import matplotlib.pyplot as plt

x = [1, 2, 3, 4, 5]
y = [2, 4, 6, 8, 10]

fig, ax = plt.subplots()
ax.plot(x, y)

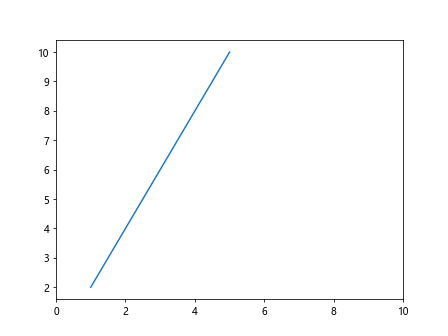
ax.set_xlim(0, 10) # 拉伸x轴范围至0到10
plt.show()
Output:
方法五:通过修改坐标系实现拉伸
import matplotlib.pyplot as plt

x = [1, 2, 3, 4, 5]
y = [2, 4, 6, 8, 10]

fig, ax = plt.subplots()

ax.plot(x, y)
ax.set_xlim(0, 10) # 拉伸x轴范围至0到10

plt.show()
Output:
方法六:使用plt.gca函数
import matplotlib.pyplot as plt

x = [1, 2, 3, 4, 5]
y = [2, 4, 6, 8, 10]

plt.plot(x, y)
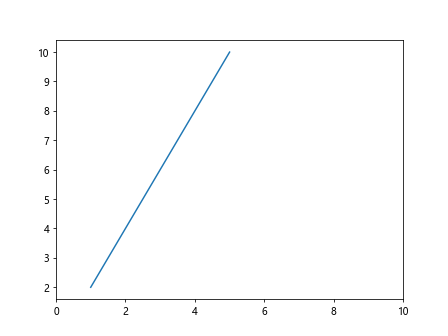
plt.gca().set_xlim([0, 10]) # 使用plt.gca函数拉伸x轴范围至0到10
plt.show()
Output:
方法七:自定义坐标轴刻度
import matplotlib.pyplot as plt

x = [1, 2, 3, 4, 5]
y = [2, 4, 6, 8, 10]

plt.plot(x, y)
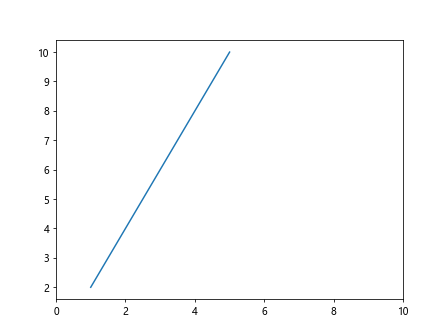
plt.xticks(range(0, 11, 2)) # 定义x轴刻度为0到10,步长为2
plt.show()
Output:
方法八:设置坐标轴标签
import matplotlib.pyplot as plt

x = [1, 2, 3, 4, 5]
y = [2, 4, 6, 8, 10]

plt.plot(x, y)
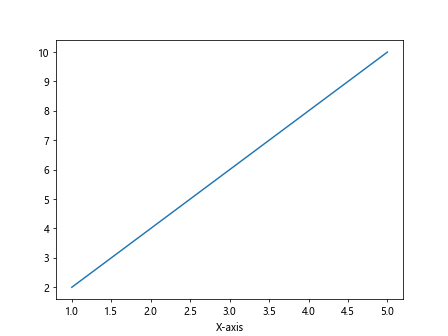
plt.xlabel('X-axis') # 设置x轴标签
plt.show()
Output:
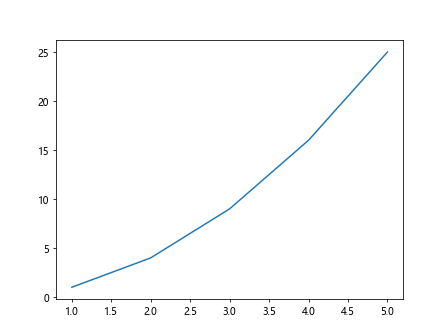
方法九:修改分辨率实现拉伸效果
import matplotlib.pyplot as plt

plt.figure(dpi=100) # 修改分辨率为100
plt.plot([1, 2, 3, 4, 5], [1, 4, 9, 16, 25])
plt.show()
Output:
方法十:使用figsize参数设置图形大小
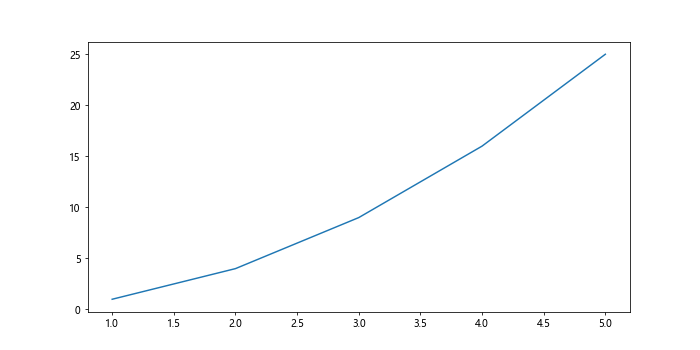
import matplotlib.pyplot as plt

plt.figure(figsize=(10, 5)) # 设置图形大小为10x5
plt.plot([1, 2, 3, 4, 5], [1, 4, 9, 16, 25])
plt.show()
Output:
方法十一:使用tight_layout函数
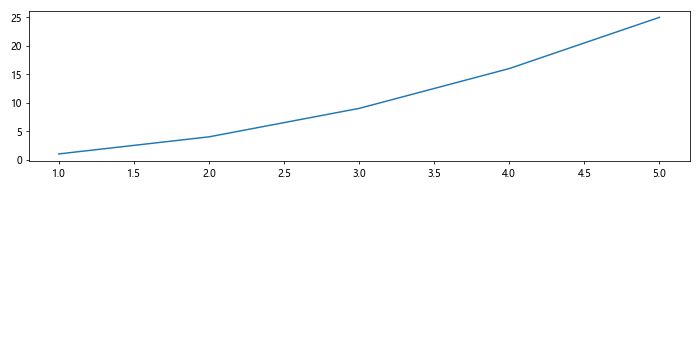
import matplotlib.pyplot as plt

plt.figure(figsize=(10, 5)) # 设置图形大小为10x5

plt.subplot(211)
plt.plot([1, 2, 3, 4, 5], [1, 4, 9, 16, 25])

plt.tight_layout() # 调整子图之间的距离
plt.show()
Output:
方法十二:添加网格线使图表更加清晰
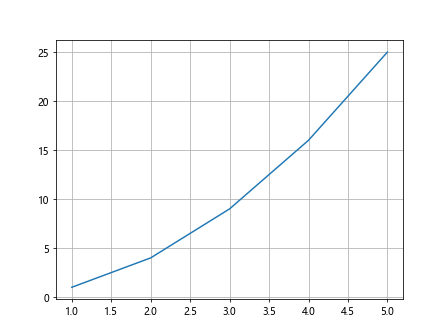
import matplotlib.pyplot as plt

plt.grid(True) # 添加网格线
plt.plot([1, 2, 3, 4, 5], [1, 4, 9, 16, 25])
plt.show()
Output:
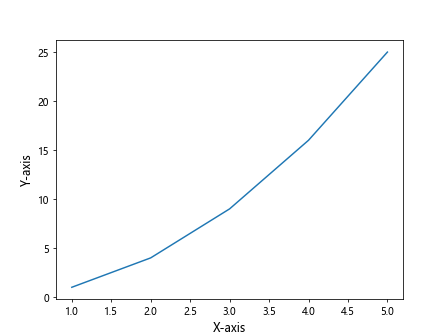
方法十三:调整标签字体和大小
import matplotlib.pyplot as plt

plt.xlabel('X-axis', fontsize=12) # 设置x轴标签字体大小为12
plt.ylabel('Y-axis', fontsize=12) # 设置y轴标签字体大小为12
plt.plot([1, 2, 3, 4, 5], [1, 4, 9, 16, 25])
plt.show()
Output:
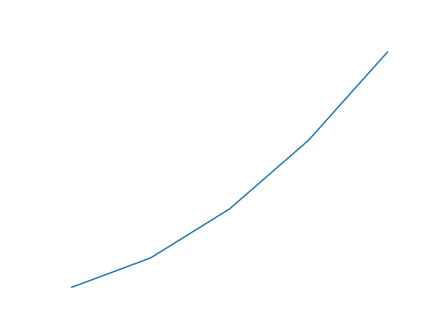
方法十四:隐藏坐标轴
import matplotlib.pyplot as plt

plt.axis('off') # 隐藏坐标轴
plt.plot([1, 2, 3, 4, 5], [1, 4, 9, 16, 25])
plt.show()
Output:
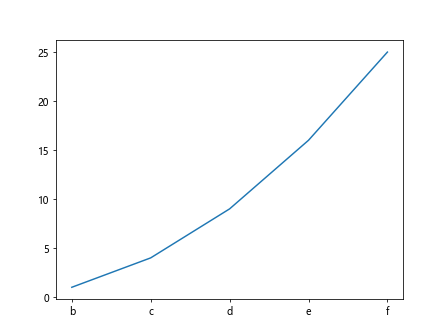
方法十五:修改坐标轴刻度标签
import matplotlib.pyplot as plt

plt.xticks(range(0, 6), ['a', 'b', 'c', 'd', 'e', 'f']) # 修改x轴刻度标签
plt.plot([1, 2, 3, 4, 5], [1, 4, 9, 16, 25])
plt.show()
Output:
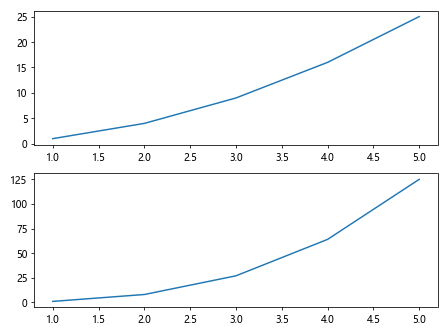
方法十六:调整布局以适应不同需求
import matplotlib.pyplot as plt

plt.subplot(211) # 创建上半部分子图
plt.plot([1, 2, 3, 4, 5], [1, 4, 9, 16, 25])

plt.subplot(212) # 创建下半部分子图
plt.plot([1, 2, 3, 4, 5], [1, 8, 27, 64, 125])

plt.tight_layout() # 调整子图之间的距离
plt.show()
Output:
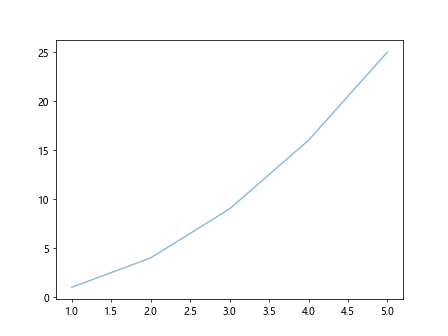
方法十七:使用透明度调整图表效果
import matplotlib.pyplot as plt

plt.plot([1, 2, 3, 4, 5], [1, 4, 9, 16, 25], alpha=0.5) # 设置透明度为0.5
plt.show()
Output:
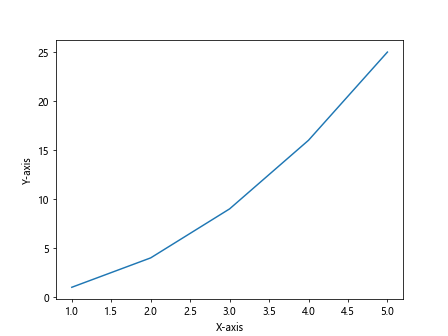
方法十八:设置坐标轴标题
import matplotlib.pyplot as plt

plt.xlabel('X-axis') # 设置x轴标题
plt.ylabel('Y-axis') # 设置y轴标题
plt.plot([1, 2, 3, 4, 5], [1, 4, 9, 16, 25])
plt.show()
Output:
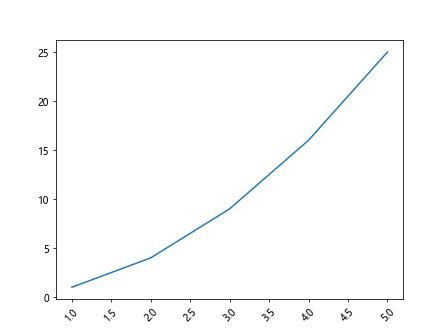
方法十九:调整坐标轴刻度方向
import matplotlib.pyplot as plt

plt.xticks(rotation=45) # 设置x轴刻度标签旋转45度
plt.plot([1, 2, 3, 4, 5], [1, 4, 9, 16, 25])
plt.show()
Output:
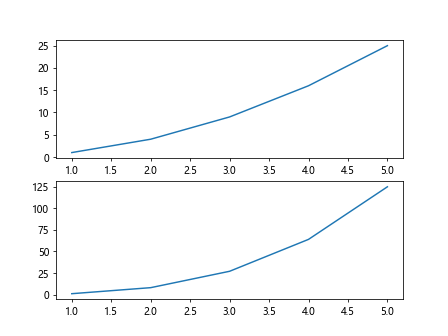
方法二十:使用子图实现多个图表的展示
import matplotlib.pyplot as plt

plt.subplot(211) # 创建上半部分子图
plt.plot([1, 2, 3, 4, 5], [1, 4, 9, 16, 25])

plt.subplot(212) # 创建下半部分子图
plt.plot([1, 2, 3, 4, 5], [1, 8, 27, 64, 125])

plt.show()
Output:
通过本文的介绍,我们了解了如何在matplotlib中拉伸x轴,从调整坐标轴范围到修改图表大小和布局等多个方面进行了详细讲解。
 极客教程
极客教程