如何在Python中移除Matplotlib图形的边框
参考:How to remove the frame from a Matplotlib figure in Python
Matplotlib是Python中最流行的数据可视化库之一,它提供了丰富的绘图功能和自定义选项。在创建图表时,有时我们可能希望移除图形周围的边框,以获得更简洁、更专业的外观。本文将详细介绍如何在Python中使用Matplotlib移除图形的边框,并提供多种方法和技巧来实现这一目标。
1. 理解Matplotlib图形结构
在开始移除边框之前,我们需要了解Matplotlib图形的基本结构。一个典型的Matplotlib图形由以下几个主要部分组成:
- Figure(图形):整个图形的容器
- Axes(坐标轴):包含数据的实际绘图区域
- Spines(脊柱):围绕坐标轴的边界线
边框通常由四条脊柱组成:top(顶部)、bottom(底部)、left(左侧)和right(右侧)。要移除边框,我们需要操作这些脊柱。
让我们从一个基本的示例开始,创建一个简单的图形:
import matplotlib.pyplot as plt

# 创建数据
x = [1, 2, 3, 4, 5]
y = [2, 4, 6, 8, 10]

# 创建图形和坐标轴
fig, ax = plt.subplots()

# 绘制数据
ax.plot(x, y, label='how2matplotlib.com')

# 添加标题和标签
ax.set_title('Basic Plot')
ax.set_xlabel('X-axis')
ax.set_ylabel('Y-axis')

# 显示图例
ax.legend()

# 显示图形
plt.show()
Output:
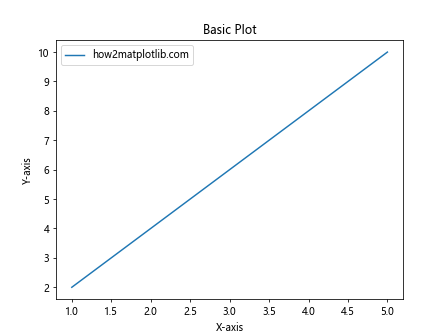
这个示例创建了一个基本的线图,包含完整的边框。接下来,我们将探讨如何移除这个边框。
2. 使用spines属性移除边框
最直接的方法是使用Axes对象的spines属性来移除边框。我们可以通过将脊柱的可见性设置为False来实现这一点。
import matplotlib.pyplot as plt

x = [1, 2, 3, 4, 5]
y = [2, 4, 6, 8, 10]

fig, ax = plt.subplots()
ax.plot(x, y, label='how2matplotlib.com')

# 移除所有脊柱
for spine in ax.spines.values():
    spine.set_visible(False)

ax.set_title('Plot without Frame')
ax.set_xlabel('X-axis')
ax.set_ylabel('Y-axis')
ax.legend()

plt.show()
Output:
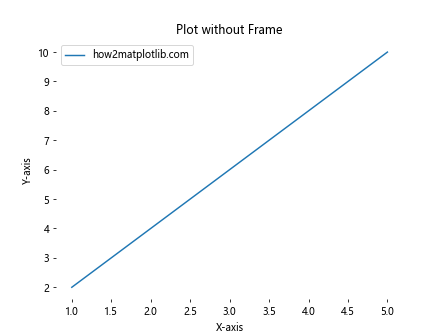
在这个示例中,我们遍历了所有的脊柱,并将它们的可见性设置为False。这样就移除了整个边框。
3. 选择性移除特定边框
有时,我们可能只想移除部分边框,而保留其他部分。例如,我们可能想保留底部和左侧的边框,以显示坐标轴,但移除顶部和右侧的边框。
import matplotlib.pyplot as plt

x = [1, 2, 3, 4, 5]
y = [2, 4, 6, 8, 10]

fig, ax = plt.subplots()
ax.plot(x, y, label='how2matplotlib.com')

# 移除顶部和右侧的脊柱
ax.spines['top'].set_visible(False)
ax.spines['right'].set_visible(False)

ax.set_title('Plot with Partial Frame')
ax.set_xlabel('X-axis')
ax.set_ylabel('Y-axis')
ax.legend()

plt.show()
Output:
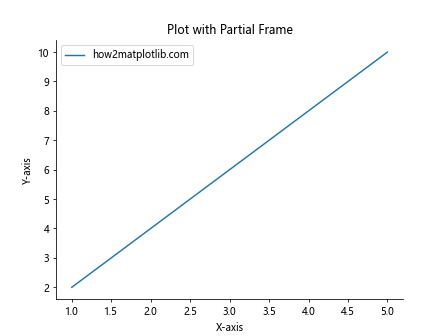
这个示例保留了底部和左侧的边框,创建了一个更加开放的图形外观。
4. 使用despine()函数
Seaborn是建立在Matplotlib之上的统计数据可视化库,它提供了一个方便的despine()函数,可以轻松移除图形的边框。虽然这不是纯Matplotlib的解决方案,但它值得一提,因为它非常简单易用。
import matplotlib.pyplot as plt
import seaborn as sns

x = [1, 2, 3, 4, 5]
y = [2, 4, 6, 8, 10]

fig, ax = plt.subplots()
ax.plot(x, y, label='how2matplotlib.com')

# 使用seaborn移除边框
sns.despine()

ax.set_title('Plot using Seaborn despine()')
ax.set_xlabel('X-axis')
ax.set_ylabel('Y-axis')
ax.legend()

plt.show()
Output:
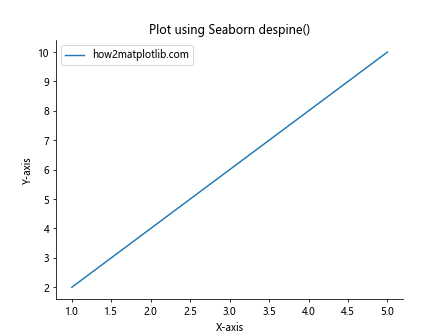
默认情况下,despine()函数会移除顶部和右侧的边框。你也可以通过传递参数来自定义要移除的边框。
5. 调整脊柱位置
除了完全移除边框,我们还可以通过调整脊柱的位置来创建不同的视觉效果。例如,我们可以将x轴和y轴移动到原点。
import matplotlib.pyplot as plt

x = [-2, -1, 0, 1, 2]
y = [4, 1, 0, 1, 4]

fig, ax = plt.subplots()
ax.plot(x, y, label='how2matplotlib.com')

# 移动脊柱到原点
ax.spines['left'].set_position('center')
ax.spines['bottom'].set_position('center')

# 移除顶部和右侧的脊柱
ax.spines['top'].set_visible(False)
ax.spines['right'].set_visible(False)

ax.set_title('Plot with Spines at Origin')
ax.legend()

plt.show()
Output:
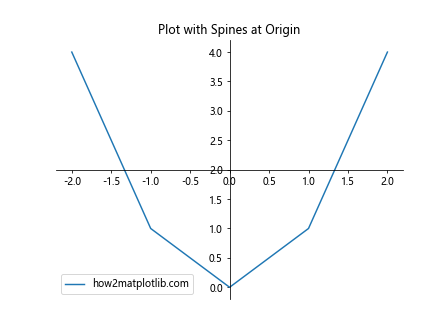
这个示例创建了一个类似于数学坐标系的图形,x轴和y轴相交于原点。
6. 使用axis参数
Matplotlib提供了一个简单的方法来控制坐标轴的显示。我们可以使用axis参数来快速移除所有边框。
import matplotlib.pyplot as plt

x = [1, 2, 3, 4, 5]
y = [2, 4, 6, 8, 10]

fig, ax = plt.subplots()
ax.plot(x, y, label='how2matplotlib.com')

# 移除所有边框
ax.axis('off')

ax.set_title('Plot with axis off')
ax.legend()

plt.show()
Output:
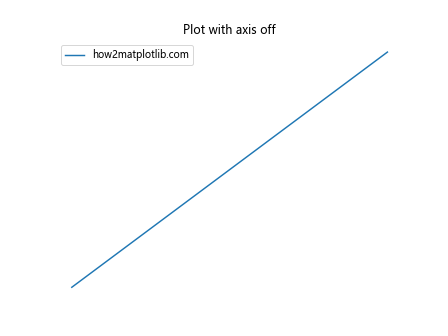
这个方法不仅移除了边框,还移除了坐标轴标签和刻度。这在创建某些类型的图表(如热图或图像)时特别有用。
7. 自定义边框样式
有时,我们可能不想完全移除边框,而是想改变其样式。Matplotlib允许我们自定义边框的颜色、线型和宽度。
import matplotlib.pyplot as plt

x = [1, 2, 3, 4, 5]
y = [2, 4, 6, 8, 10]

fig, ax = plt.subplots()
ax.plot(x, y, label='how2matplotlib.com')

# 自定义边框样式
ax.spines['top'].set_color('red')
ax.spines['right'].set_color('none')
ax.spines['bottom'].set_linewidth(2)
ax.spines['left'].set_linestyle('--')

ax.set_title('Plot with Custom Frame Style')
ax.set_xlabel('X-axis')
ax.set_ylabel('Y-axis')
ax.legend()

plt.show()
Output:
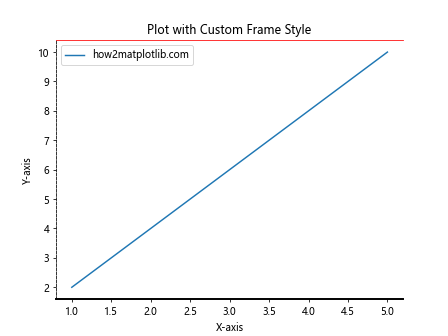
这个示例展示了如何为每个边框设置不同的样式,包括颜色、线宽和线型。
8. 使用tight_layout()
当移除边框时,有时图形的内容可能会显得过于拥挤或者离边缘太近。使用tight_layout()函数可以自动调整子图参数,以给予轴标签等足够的空间。
import matplotlib.pyplot as plt

x = [1, 2, 3, 4, 5]
y = [2, 4, 6, 8, 10]

fig, ax = plt.subplots()
ax.plot(x, y, label='how2matplotlib.com')

# 移除所有脊柱
for spine in ax.spines.values():
    spine.set_visible(False)

ax.set_title('Plot with tight_layout()')
ax.set_xlabel('X-axis')
ax.set_ylabel('Y-axis')
ax.legend()

# 应用tight_layout
plt.tight_layout()

plt.show()
Output:
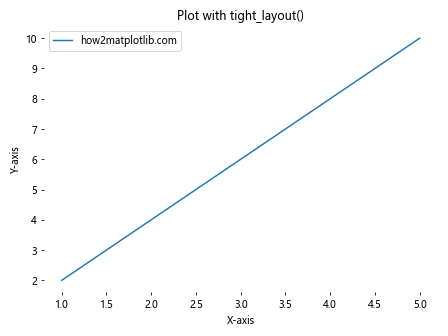
tight_layout()函数会自动调整子图的位置,确保所有元素都能正确显示,不会被裁剪。
9. 在子图中移除边框
当我们有多个子图时,可能需要为每个子图单独移除边框。这可以通过遍历所有子图并应用相同的技术来实现。
import matplotlib.pyplot as plt

fig, (ax1, ax2) = plt.subplots(1, 2, figsize=(10, 4))

x = [1, 2, 3, 4, 5]
y1 = [2, 4, 6, 8, 10]
y2 = [1, 3, 5, 7, 9]

ax1.plot(x, y1, label='how2matplotlib.com 1')
ax2.plot(x, y2, label='how2matplotlib.com 2')

# 移除两个子图的边框
for ax in [ax1, ax2]:
    for spine in ax.spines.values():
        spine.set_visible(False)
    ax.set_xlabel('X-axis')
    ax.set_ylabel('Y-axis')
    ax.legend()

ax1.set_title('Subplot 1')
ax2.set_title('Subplot 2')

plt.tight_layout()
plt.show()
Output:
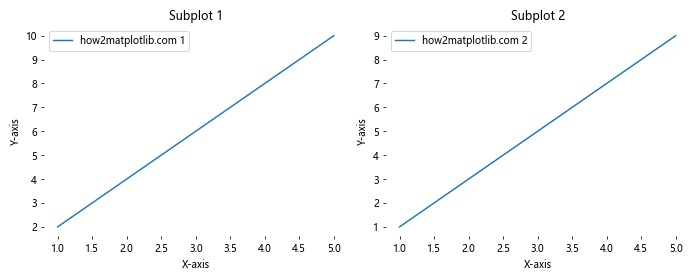
这个示例创建了两个并排的子图,并移除了它们的边框。
10. 使用面向对象的方法
到目前为止,我们主要使用了Matplotlib的面向对象接口。这是推荐的方法,因为它提供了更多的灵活性和控制。然而,Matplotlib也提供了一个状态机接口,也称为pyplot接口。让我们看看如何使用这种方法移除边框。
import matplotlib.pyplot as plt

x = [1, 2, 3, 4, 5]
y = [2, 4, 6, 8, 10]

plt.plot(x, y, label='how2matplotlib.com')

# 移除边框
plt.gca().spines['top'].set_visible(False)
plt.gca().spines['right'].set_visible(False)
plt.gca().spines['bottom'].set_visible(False)
plt.gca().spines['left'].set_visible(False)

plt.title('Plot using pyplot interface')
plt.xlabel('X-axis')
plt.ylabel('Y-axis')
plt.legend()

plt.show()
Output:
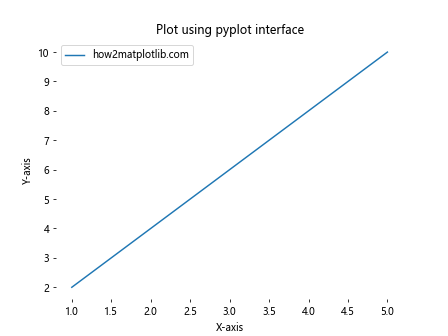
在这个示例中,我们使用plt.gca()(get current axes)来获取当前的坐标轴对象,然后操作其脊柱。
11. 结合图例和边框移除
当我们移除边框时,可能需要调整图例的位置以获得更好的视觉效果。Matplotlib允许我们自定义图例的位置和样式。
import matplotlib.pyplot as plt

x = [1, 2, 3, 4, 5]
y1 = [2, 4, 6, 8, 10]
y2 = [1, 3, 5, 7, 9]

fig, ax = plt.subplots()
ax.plot(x, y1, label='how2matplotlib.com 1')
ax.plot(x, y2, label='how2matplotlib.com 2')

# 移除边框
for spine in ax.spines.values():
    spine.set_visible(False)

ax.set_title('Plot with Custom Legend')
ax.set_xlabel('X-axis')
ax.set_ylabel('Y-axis')

# 自定义图例
ax.legend(loc='upper left', bbox_to_anchor=(1, 1), frameon=False)

plt.tight_layout()
plt.show()
Output:
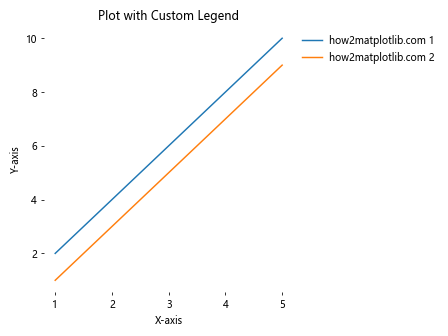
在这个示例中,我们将图例移到了图形的右上角,并通过设置frameon=False移除了图例的边框。
12. 使用set_frame_on()方法
另一种移除整个边框的方法是使用set_frame_on()方法。这个方法可以一次性移除所有的脊柱。
import matplotlib.pyplot as plt

x = [1, 2, 3, 4, 5]
y = [2, 4, 6, 8, 10]

fig, ax = plt.subplots()
ax.plot(x, y, label='how2matplotlib.com')

# 移除整个边框
ax.set_frame_on(False)

ax.set_title('Plot using set_frame_on(False)')
ax.set_xlabel('X-axis')
ax.set_ylabel('Y-axis')
ax.legend()

plt.show()
Output:
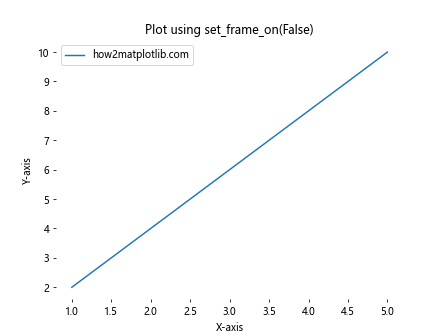
这个方法的优点是简单直接,一行代码就可以移除所有边框。
13. 结合网格线和无边框
有时,我们可能想要移除边框但保留网格线,以帮助读者更好地解读数据。Matplotlib允许我们轻松地添加网格线。
import matplotlib.pyplot as plt

x = [1, 2, 3, 4, 5]
y = [2, 4, 6, 8, 10]

fig, ax = plt.subplots()
ax.plot(x, y, label='how2matplotlib.com')

# 移除边框
for spine in ax.spines.values():
    spine.set_visible(False)

# 添加网格线
ax.grid(True, linestyle='--', alpha=0.7)

ax.set_title('Plot with Grid and No Frame')
ax.set_xlabel('X-axis')
ax.set_ylabel('Y-axis')
ax.legend()

plt.show()
Output:
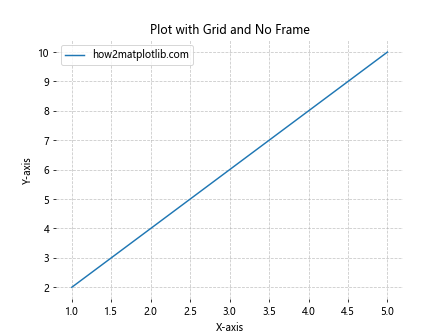
这个示例展示了如何在没有边框的情况下添加网格线,创造一个清晰但不拥挤的视觉效果。
14. 使用set_visible()和set_linewidth()的组合
我们可以结合使用set_visible()和set_linewidth()方法来创建更细微的边框效果。例如,我们可以保留边框但使其几乎不可见。
import matplotlib.pyplot as plt

x = [1, 2, 3, 4, 5]
y = [2, 4, 6, 8, 10]

fig, ax = plt.subplots()
ax.plot(x, y, label='how2matplotlib.com')

# 设置边框为极细
for spine in ax.spines.values():
    spine.set_visible(True)
    spine.set_linewidth(0.1)

ax.set_title('Plot with Very Thin Frame')
ax.set_xlabel('X-axis')
ax.set_ylabel('Y-axis')
ax.legend()

plt.show()
Output:
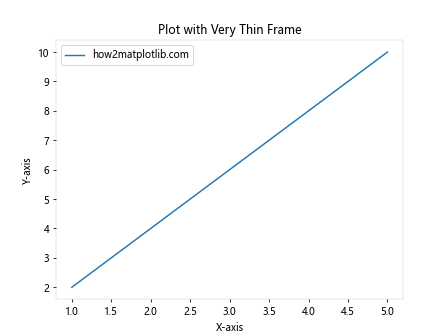
这个方法创建了一个几乎不可见的边框,给人一种无边框的感觉,同时仍然保留了一些结构。
15. 自定义刻度和标签
当移除边框时,我们可能还想自定义坐标轴的刻度和标签,以创建更加简洁的外观。
import matplotlib.pyplot as plt

x = [1, 2, 3, 4, 5]
y = [2, 4, 6, 8, 10]

fig, ax = plt.subplots()
ax.plot(x, y, label='how2matplotlib.com')

# 移除边框
for spine in ax.spines.values():
    spine.set_visible(False)

# 自定义刻度
ax.tick_params(axis='both', which='both', length=0)

# 只在底部和左侧显示刻度标签
ax.xaxis.set_ticks_position('bottom')
ax.yaxis.set_ticks_position('left')

ax.set_title('Plot with Custom Ticks')
ax.set_xlabel('X-axis')
ax.set_ylabel('Y-axis')
ax.legend()

plt.show()
Output:
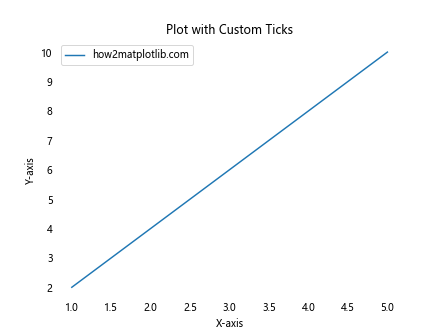
这个示例移除了刻度线,并只在底部和左侧显示刻度标签,创造了一个更加简洁的外观。
16. 使用axisbelow参数
当我们有网格线和数据点时,我们可能希望确保数据点显示在网格线之上。axisbelow参数可以帮助我们实现这一点。
import matplotlib.pyplot as plt

x = [1, 2, 3, 4, 5]
y = [2, 4, 6, 8, 10]

fig, ax = plt.subplots()
ax.plot(x, y, 'o-', label='how2matplotlib.com')

# 移除边框
for spine in ax.spines.values():
    spine.set_visible(False)

# 添加网格线并将其置于数据下方
ax.grid(True, linestyle='--', alpha=0.7)
ax.set_axisbelow(True)

ax.set_title('Plot with Grid Below Data')
ax.set_xlabel('X-axis')
ax.set_ylabel('Y-axis')
ax.legend()

plt.show()
Output:
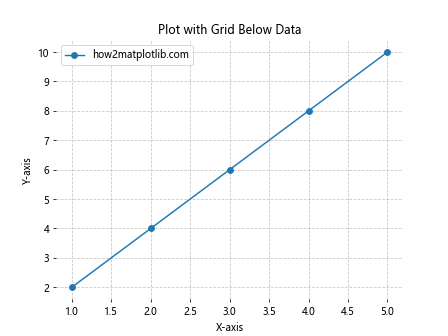
这个示例确保了网格线显示在数据点之下,使得数据点更加突出。
17. 结合颜色映射和无边框
当我们使用颜色映射(colormap)来表示数据的第三个维度时,移除边框可以让颜色更加突出。
import matplotlib.pyplot as plt
import numpy as np

x = np.linspace(0, 10, 100)
y = np.sin(x)
colors = x

fig, ax = plt.subplots()
scatter = ax.scatter(x, y, c=colors, cmap='viridis', label='how2matplotlib.com')

# 移除边框
for spine in ax.spines.values():
    spine.set_visible(False)

ax.set_title('Scatter Plot with Colormap and No Frame')
ax.set_xlabel('X-axis')
ax.set_ylabel('Y-axis')

# 添加颜色条
plt.colorbar(scatter)

plt.show()
Output:
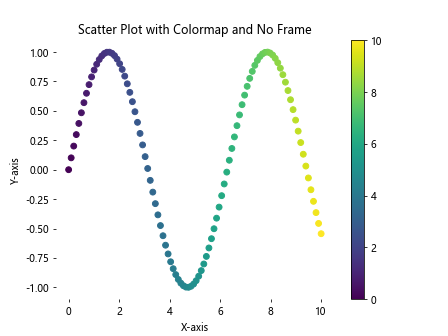
这个示例创建了一个散点图,使用颜色来表示x值的大小,并移除了边框以突出颜色变化。
18. 在极坐标图中移除边框
极坐标图是另一种常见的图表类型,我们也可以为其移除边框。
import matplotlib.pyplot as plt
import numpy as np

r = np.arange(0, 2, 0.01)
theta = 2 * np.pi * r

fig, ax = plt.subplots(subplot_kw={'projection': 'polar'})
ax.plot(theta, r, label='how2matplotlib.com')

# 移除径向刻度标签
ax.set_yticks([])

# 移除外圈
ax.spines['polar'].set_visible(False)

ax.set_title('Polar Plot without Frame')
ax.legend()

plt.show()
Output:
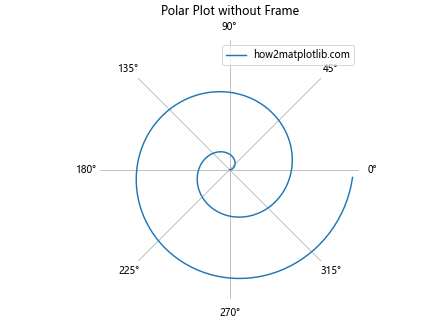
这个示例创建了一个极坐标图,并移除了外圈和径向刻度标签,创造了一个更加简洁的外观。
19. 在3D图中移除边框
Matplotlib也支持3D图形,我们同样可以为3D图移除边框。
import matplotlib.pyplot as plt
import numpy as np

fig = plt.figure()
ax = fig.add_subplot(111, projection='3d')

# 生成数据
x = np.arange(-5, 5, 0.25)
y = np.arange(-5, 5, 0.25)
x, y = np.meshgrid(x, y)
r = np.sqrt(x**2 + y**2)
z = np.sin(r)

# 绘制曲面
surf = ax.plot_surface(x, y, z, cmap='viridis', label='how2matplotlib.com')

# 移除边框
ax.set_box_aspect(None, zoom=0.9)
ax.set_axis_off()

ax.set_title('3D Surface Plot without Frame')

plt.show()
Output:
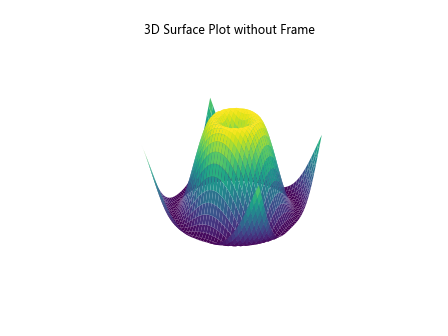
这个示例创建了一个3D曲面图,并通过设置box_aspect和axis_off来移除边框和坐标轴。
20. 使用style sheets移除边框
Matplotlib提供了样式表(style sheets),可以一次性应用一组预定义的样式设置。我们可以使用或创建一个无边框的样式表。
import matplotlib.pyplot as plt

# 创建自定义样式
plt.style.use({
    'axes.spines.left': False,
    'axes.spines.bottom': False,
    'axes.spines.top': False,
    'axes.spines.right': False,
    'xtick.bottom': False,
    'ytick.left': False
})

x = [1, 2, 3, 4, 5]
y = [2, 4, 6, 8, 10]

plt.plot(x, y, label='how2matplotlib.com')
plt.title('Plot using Custom Style Sheet')
plt.xlabel('X-axis')
plt.ylabel('Y-axis')
plt.legend()

plt.show()
Output:
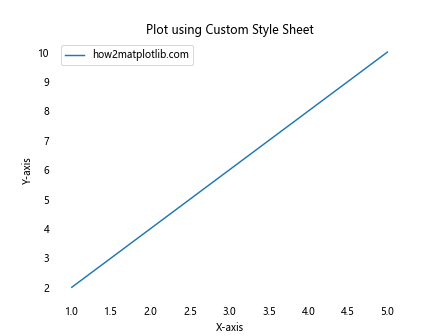
这个示例展示了如何创建和使用自定义样式来移除边框和刻度线。
总结
在本文中,我们探讨了多种在Python中使用Matplotlib移除图形边框的方法。从简单的spines操作到更复杂的样式自定义,我们涵盖了广泛的技术和应用场景。移除边框不仅可以创造更加简洁和现代的视觉效果,还可以让读者更加专注于数据本身。
记住,图形的设计应该始终服务于数据的清晰表达。在某些情况下,保留部分或全部边框可能更有利于数据的解读。因此,在决定是否移除边框时,要考虑你的目标受众和数据的性质。
通过掌握这些技术,你可以更好地控制Matplotlib图形的外观,创造出既美观又有效的数据可视化。无论你是在进行科学研究、数据分析还是创建报告,这些方法都将帮助你制作出更专业、更有吸引力的图表。
继续实践和探索Matplotlib的其他功能,你会发现更多定制化的可能性,从而创造出真正独特和有影响力的数据可视化作品。
 极客教程
极客教程