如何在Python中为Matplotlib图表生成随机颜色
参考:How to generate a random color for a Matplotlib plot in Python
Matplotlib是Python中最流行的数据可视化库之一,它提供了丰富的绘图功能和自定义选项。在创建图表时,选择合适的颜色方案对于提高可读性和美观度至关重要。有时,我们可能需要为图表元素生成随机颜色,以增加视觉多样性或区分不同的数据系列。本文将详细介绍如何在Python中为Matplotlib图表生成随机颜色,并提供多种方法和实用技巧。
1. 使用随机RGB值生成颜色
最直接的方法是使用随机生成的RGB(红、绿、蓝)值来创建颜色。RGB颜色模型中,每个颜色通道的值范围是0到1(或0到255)。我们可以使用Python的random模块来生成这些随机值。
import matplotlib.pyplot as plt
import random

# 生成随机RGB颜色
def random_color():
    return (random.random(), random.random(), random.random())

# 创建示例图表
plt.figure(figsize=(8, 6))
for i in range(5):
    x = range(10)
    y = [random.randint(1, 10) for _ in range(10)]
    plt.plot(x, y, color=random_color(), label=f'Line {i+1} - how2matplotlib.com')

plt.title('Random Color Lines - how2matplotlib.com')
plt.xlabel('X-axis')
plt.ylabel('Y-axis')
plt.legend()
plt.show()
Output:
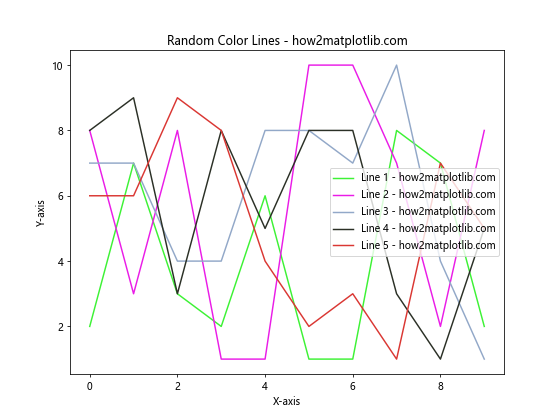
在这个示例中,我们定义了一个random_color()函数,它返回一个由三个随机浮点数组成的元组,表示RGB颜色。然后,我们创建了5条随机颜色的线,每条线都使用random_color()函数生成的颜色。
2. 使用Matplotlib内置的颜色映射
Matplotlib提供了许多预定义的颜色映射(colormap),我们可以从这些映射中随机选择颜色。这种方法可以确保生成的颜色在视觉上更加协调。
import matplotlib.pyplot as plt
import numpy as np

# 从颜色映射中随机选择颜色
cmap = plt.cm.viridis
colors = cmap(np.random.rand(5))

plt.figure(figsize=(8, 6))
for i in range(5):
    x = range(10)
    y = np.random.randint(1, 10, 10)
    plt.scatter(x, y, color=colors[i], label=f'Scatter {i+1} - how2matplotlib.com')

plt.title('Random Colors from Colormap - how2matplotlib.com')
plt.xlabel('X-axis')
plt.ylabel('Y-axis')
plt.legend()
plt.show()
Output:
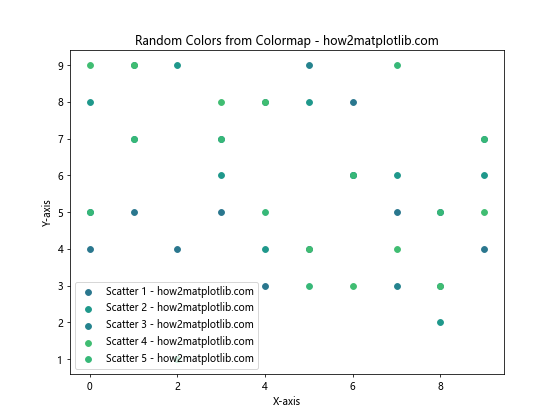
在这个例子中,我们使用了viridis颜色映射,并从中随机选择了5种颜色。这种方法可以产生更加和谐的颜色组合。
3. 使用HSV颜色空间生成随机颜色
HSV(色相、饱和度、明度)颜色空间提供了另一种生成随机颜色的方法。通过随机选择色相值,同时固定饱和度和明度,我们可以创建鲜艳且区分度高的颜色。
import matplotlib.pyplot as plt
import colorsys
import random

def random_hsv_color(h_range=(0, 1), s_range=(0.5, 1), v_range=(0.5, 1)):
    h = random.uniform(*h_range)
    s = random.uniform(*s_range)
    v = random.uniform(*v_range)
    return colorsys.hsv_to_rgb(h, s, v)

plt.figure(figsize=(8, 6))
for i in range(5):
    x = range(10)
    y = [random.randint(1, 10) for _ in range(10)]
    color = random_hsv_color()
    plt.plot(x, y, color=color, label=f'Line {i+1} - how2matplotlib.com')

plt.title('Random HSV Colors - how2matplotlib.com')
plt.xlabel('X-axis')
plt.ylabel('Y-axis')
plt.legend()
plt.show()
Output:
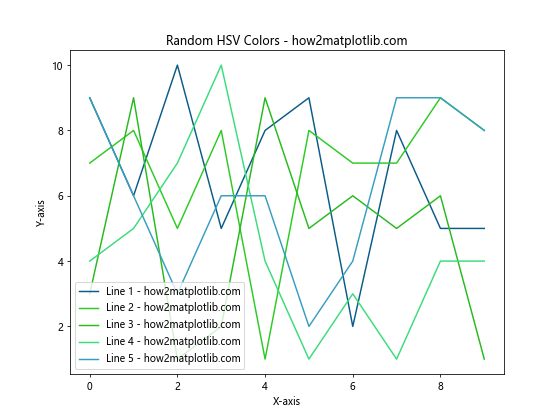
这个示例定义了一个random_hsv_color()函数,它生成随机的HSV颜色,并将其转换为RGB格式。通过调整色相、饱和度和明度的范围,我们可以控制生成的颜色的特性。
4. 使用预定义的颜色列表
有时,我们可能希望从一组预定义的颜色中随机选择,以确保颜色的一致性和可读性。
import matplotlib.pyplot as plt
import random

# 预定义的颜色列表
colors = ['#FF9999', '#66B2FF', '#99FF99', '#FFCC99', '#FF99CC', '#99CCFF']

plt.figure(figsize=(8, 6))
for i in range(5):
    x = range(10)
    y = [random.randint(1, 10) for _ in range(10)]
    color = random.choice(colors)
    plt.bar(x, y, color=color, alpha=0.7, label=f'Bar {i+1} - how2matplotlib.com')

plt.title('Random Colors from Predefined List - how2matplotlib.com')
plt.xlabel('X-axis')
plt.ylabel('Y-axis')
plt.legend()
plt.show()
Output:
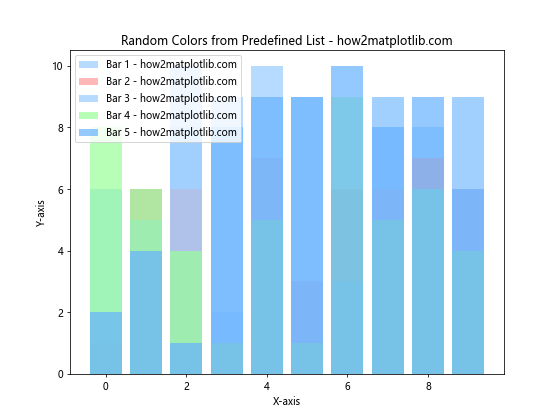
在这个例子中,我们定义了一个包含六种颜色的列表,并使用random.choice()函数从中随机选择颜色。这种方法可以确保颜色的一致性,同时仍然提供一定程度的随机性。
5. 生成互补色
为了创建视觉上更加平衡的图表,我们可以生成互补色。互补色是在色轮上相对的两种颜色,它们可以创造出强烈的对比效果。
import matplotlib.pyplot as plt
import colorsys
import random

def complementary_color(rgb_color):
    h, s, v = colorsys.rgb_to_hsv(*rgb_color)
    h = (h + 0.5) % 1.0
    return colorsys.hsv_to_rgb(h, s, v)

plt.figure(figsize=(8, 6))
for i in range(3):
    x = range(10)
    y1 = [random.randint(1, 10) for _ in range(10)]
    y2 = [random.randint(1, 10) for _ in range(10)]

    color1 = (random.random(), random.random(), random.random())
    color2 = complementary_color(color1)

    plt.plot(x, y1, color=color1, label=f'Line {2*i+1} - how2matplotlib.com')
    plt.plot(x, y2, color=color2, label=f'Line {2*i+2} - how2matplotlib.com')

plt.title('Complementary Colors - how2matplotlib.com')
plt.xlabel('X-axis')
plt.ylabel('Y-axis')
plt.legend()
plt.show()
Output:
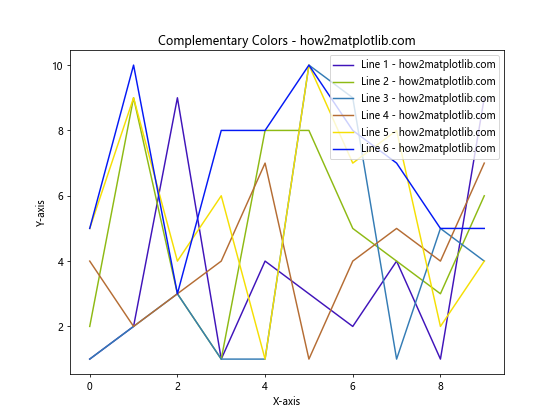
这个示例定义了一个complementary_color()函数,它接受一个RGB颜色并返回其互补色。我们生成三对互补色的线条,创造出视觉上引人注目的对比效果。
6. 使用颜色渐变
颜色渐变可以为图表添加深度和层次感。我们可以创建一个函数来生成一系列渐变色。
import matplotlib.pyplot as plt
import numpy as np

def color_gradient(start_color, end_color, steps):
    r1, g1, b1 = start_color
    r2, g2, b2 = end_color
    r_step = (r2 - r1) / steps
    g_step = (g2 - g1) / steps
    b_step = (b2 - b1) / steps
    return [(r1 + i*r_step, g1 + i*g_step, b1 + i*b_step) for i in range(steps)]

start_color = (0.1, 0.1, 0.9)  # 深蓝色
end_color = (0.9, 0.1, 0.1)    # 深红色
steps = 10

colors = color_gradient(start_color, end_color, steps)

plt.figure(figsize=(8, 6))
for i, color in enumerate(colors):
    x = range(10)
    y = np.random.randint(1, 10, 10)
    plt.plot(x, y, color=color, label=f'Line {i+1} - how2matplotlib.com')

plt.title('Color Gradient - how2matplotlib.com')
plt.xlabel('X-axis')
plt.ylabel('Y-axis')
plt.legend()
plt.show()
Output:
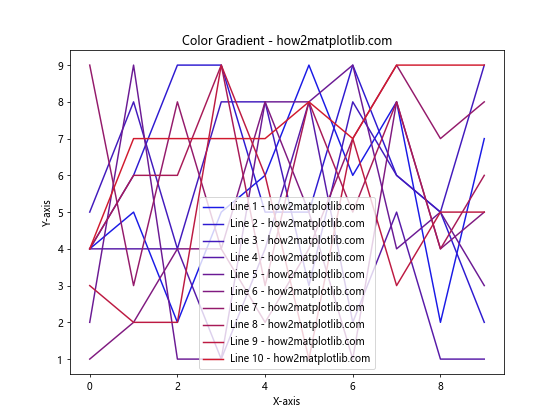
这个例子定义了一个color_gradient()函数,它生成从起始颜色到结束颜色的渐变色列表。我们使用这些渐变色来绘制多条线,创造出平滑的颜色过渡效果。
7. 使用透明度
透明度可以帮助我们在使用随机颜色时避免颜色过于饱和或刺眼。我们可以为随机生成的颜色添加透明度。
import matplotlib.pyplot as plt
import random

plt.figure(figsize=(8, 6))
for i in range(10):
    x = range(10)
    y = [random.randint(1, 10) for _ in range(10)]
    color = (random.random(), random.random(), random.random(), 0.5)  # 添加透明度
    plt.scatter(x, y, color=color, s=100, label=f'Scatter {i+1} - how2matplotlib.com')

plt.title('Random Colors with Transparency - how2matplotlib.com')
plt.xlabel('X-axis')
plt.ylabel('Y-axis')
plt.legend()
plt.show()
Output:
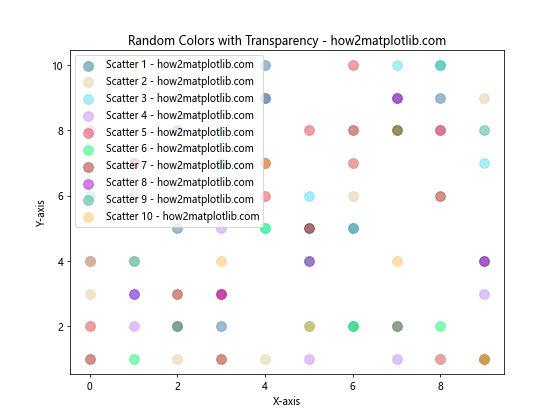
在这个示例中,我们为每个散点图元素生成一个随机颜色,并设置透明度为0.5。这样可以减少颜色的视觉冲击,同时允许重叠元素的可见性。
8. 使用自定义颜色范围
有时我们可能想要在特定的颜色范围内生成随机颜色。例如,我们可能只想要暖色调或冷色调的颜色。
import matplotlib.pyplot as plt
import random

def random_color_in_range(r_range, g_range, b_range):
    r = random.uniform(*r_range)
    g = random.uniform(*g_range)
    b = random.uniform(*b_range)
    return (r, g, b)

# 暖色调范围
warm_range = ((0.5, 1), (0, 0.5), (0, 0.5))

plt.figure(figsize=(8, 6))
for i in range(5):
    x = range(10)
    y = [random.randint(1, 10) for _ in range(10)]
    color = random_color_in_range(*warm_range)
    plt.plot(x, y, color=color, linewidth=2, label=f'Line {i+1} - how2matplotlib.com')

plt.title('Random Warm Colors - how2matplotlib.com')
plt.xlabel('X-axis')
plt.ylabel('Y-axis')
plt.legend()
plt.show()
Output:
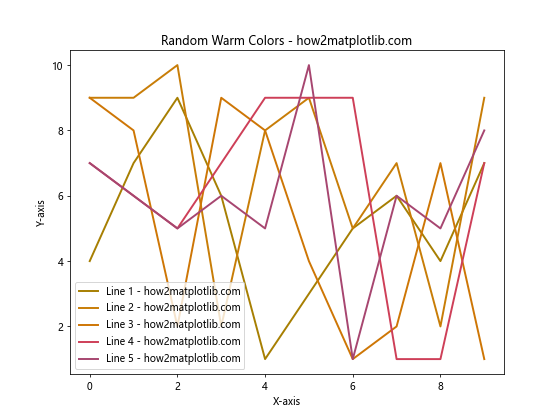
这个例子定义了一个random_color_in_range()函数,它接受RGB各个通道的范围,并在这些范围内生成随机颜色。我们使用这个函数来生成暖色调的随机颜色。
9. 使用颜色名称
Matplotlib提供了一系列预定义的颜色名称。我们可以从这些名称中随机选择,以获得可读性好的颜色。
import matplotlib.pyplot as plt
import random

# Matplotlib基本颜色名称列表
color_names = ['red', 'blue', 'green', 'yellow', 'orange', 'purple', 'pink', 'brown', 'gray', 'cyan']

plt.figure(figsize=(8, 6))
for i in range(5):
    x = range(10)
    y = [random.randint(1, 10) for _ in range(10)]
    color = random.choice(color_names)
    plt.plot(x, y, color=color, marker='o', label=f'Line {i+1} - how2matplotlib.com')

plt.title('Random Colors from Color Names - how2matplotlib.com')
plt.xlabel('X-axis')
plt.ylabel('Y-axis')
plt.legend()
plt.show()
Output:
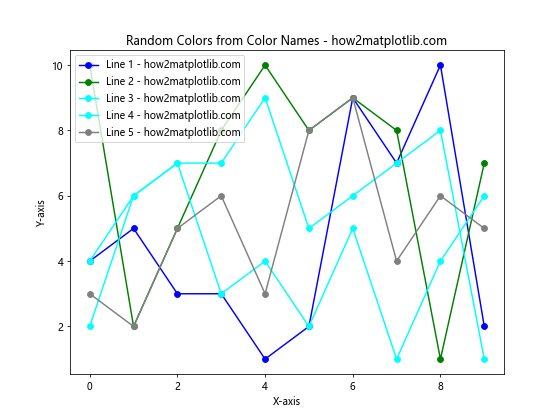
这个示例使用了Matplotlib提供的基本颜色名称列表。通过随机选择这些名称,我们可以确保使用的是易于识别和命名的颜色。
10. 使用自定义颜色生成器
我们可以创建一个自定义的颜色生成器,它可以根据特定的规则或模式生成颜色序列。
import matplotlib.pyplot as plt
import itertools

def color_generator():
    hues = [0, 60, 120, 180, 240, 300]
    saturations = [0.5, 0.75, 1]
    values = [0.5, 0.75, 1]
    for h, s, v in itertools.product(hues, saturations, values):
        yield plt.cm.hsv(h/360)

plt.figure(figsize=(8, 6))
color_gen = color_generator()

for i in range(10):
    x = range(10)
    y = [i+1] * 10
    color = next(color_gen)
    plt.plot(x, y, color=color, linewidth=2, label=f'Line {i+1} - how2matplotlib.com')

plt.title('Custom Color Generator - how2matplotlib.com')
plt.xlabel('X-axis')
plt.ylabel('Y-axis')
plt.legend()
plt.show()
Output:
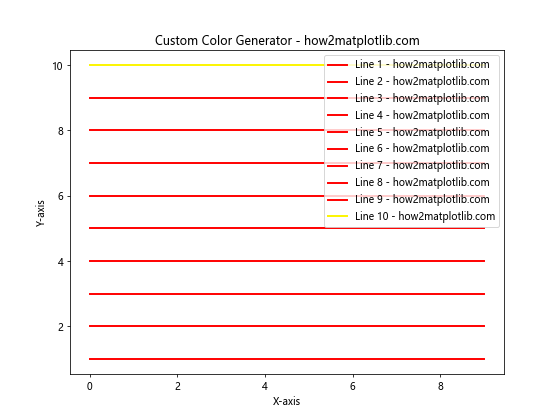
这个例子定义了一个color_generator()函数,它使用预定义的色相、饱和度和明度值生成颜色序列。这种方法可以确保生成的颜色具有一定的规律性和多样性。
11. 使用颜色循环
Matplotlib提供了内置的颜色循环,我们可以利用这些循环来为图表元素分配颜色。
import matplotlib.pyplot as plt
import numpy as np

plt.figure(figsize=(8, 6))
color_cycle = plt.rcParams['axes.prop_cycle'].by_key()['color']

for i in range(10):
    x = range(10)
    y = np.random.randint(1, 10, 10)
    color = color_cycle[i % len(color_cycle)]
    plt.plot(x, y, color=color, marker='s', label=f'Line {i+1} - how2matplotlib.com')

plt.title('Matplotlib Color Cycle - how2matplotlib.com')
plt.xlabel('X-axis')
plt.ylabel('Y-axis')
plt.legend()
plt.show()
Output:
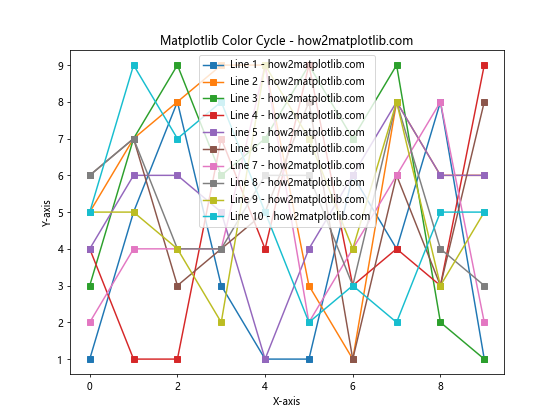
这个示例使用Matplotlib的默认颜色循环。当图表元素数量超过颜色循环中的颜色数量时,颜色会循环使用,确保每个元素都有一个颜色。
12. 使用颜色混合
我们可以通过混合两种或多种颜色来创建新的随机颜色。这种方法可以产生更加细腻和独特的颜色。
import matplotlib.pyplot as plt
import random

def blend_colors(color1, color2, ratio=0.5):
    return tuple(c1 * ratio + c2 * (1 - ratio) for c1, c2 in zip(color1, color2))

base_colors = [(1, 0, 0), (0, 1, 0), (0, 0, 1), (1, 1, 0), (1, 0, 1), (0, 1, 1)]

plt.figure(figsize=(8, 6))
for i in range(10):
    x = range(10)
    y = [random.randint(1, 10) for _ in range(10)]
    color1 = random.choice(base_colors)
    color2 = random.choice(base_colors)
    blend_ratio = random.random()
    color = blend_colors(color1, color2, blend_ratio)
    plt.plot(x, y, color=color, linewidth=2, label=f'Line {i+1} - how2matplotlib.com')

plt.title('Blended Random Colors - how2matplotlib.com')
plt.xlabel('X-axis')
plt.ylabel('Y-axis')
plt.legend()
plt.show()
Output:
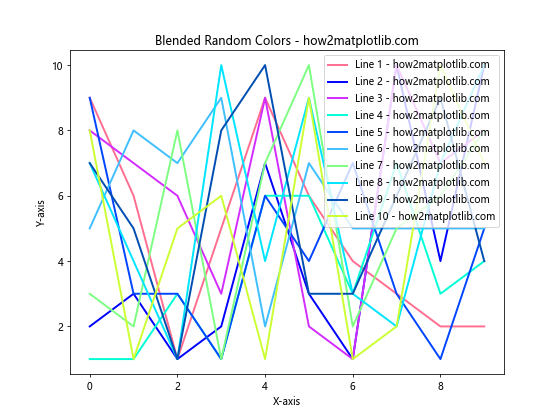
这个例子定义了一个blend_colors()函数,它可以按照给定的比例混合两种颜色。我们从一组基础颜色中随机选择两种颜色进行混合,创造出更加丰富的颜色变化。
13. 使用颜色映射生成离散颜色
虽然颜色映射通常用于连续数据,但我们也可以使用它们来生成一组离散的随机颜色。
import matplotlib.pyplot as plt
import numpy as np

plt.figure(figsize=(8, 6))
cmap = plt.cm.get_cmap('tab20')  # 使用tab20颜色映射
num_colors = 20
colors = cmap(np.linspace(0, 1, num_colors))

for i in range(num_colors):
    x = range(10)
    y = np.random.randint(1, 10, 10)
    plt.scatter(x, y, color=colors[i], s=50, label=f'Scatter {i+1} - how2matplotlib.com')

plt.title('Discrete Colors from Colormap - how2matplotlib.com')
plt.xlabel('X-axis')
plt.ylabel('Y-axis')
plt.legend(ncol=2)
plt.show()
Output:
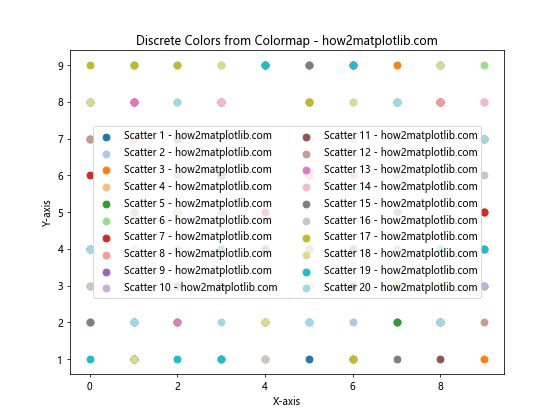
这个示例使用了’tab20’颜色映射,它提供了20种不同的颜色。我们使用np.linspace()函数在颜色映射中均匀取样,得到一组离散的颜色。
14. 使用颜色轮生成颜色
我们可以使用颜色轮的概念来生成一组均匀分布的颜色。
import matplotlib.pyplot as plt
import colorsys

def color_wheel(num_colors):
    return [colorsys.hsv_to_rgb(i/num_colors, 1.0, 1.0) for i in range(num_colors)]

plt.figure(figsize=(8, 6))
num_colors = 12
colors = color_wheel(num_colors)

for i, color in enumerate(colors):
    angle = i * (360 / num_colors)
    plt.polar([0, angle * (3.14159 / 180)], [0, 1], color=color, linewidth=3, label=f'Color {i+1} - how2matplotlib.com')

plt.title('Color Wheel - how2matplotlib.com')
plt.legend(loc='center left', bbox_to_anchor=(1, 0.5))
plt.axis('off')
plt.show()
Output:
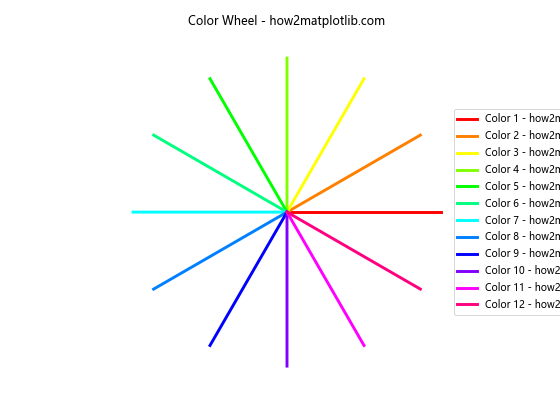
这个例子定义了一个color_wheel()函数,它生成一组均匀分布在色轮上的颜色。我们使用极坐标图来可视化这些颜色,创建了一个颜色轮的效果。
15. 使用随机种子确保可重复性
在某些情况下,我们可能需要生成随机颜色,但同时希望结果是可重复的。我们可以使用随机种子来实现这一点。
import matplotlib.pyplot as plt
import random
import numpy as np

def set_random_seed(seed):
    random.seed(seed)
    np.random.seed(seed)

plt.figure(figsize=(8, 6))
set_random_seed(42)  # 设置随机种子

for i in range(5):
    x = range(10)
    y = np.random.randint(1, 10, 10)
    color = (random.random(), random.random(), random.random())
    plt.plot(x, y, color=color, marker='o', label=f'Line {i+1} - how2matplotlib.com')

plt.title('Reproducible Random Colors - how2matplotlib.com')
plt.xlabel('X-axis')
plt.ylabel('Y-axis')
plt.legend()
plt.show()
Output:
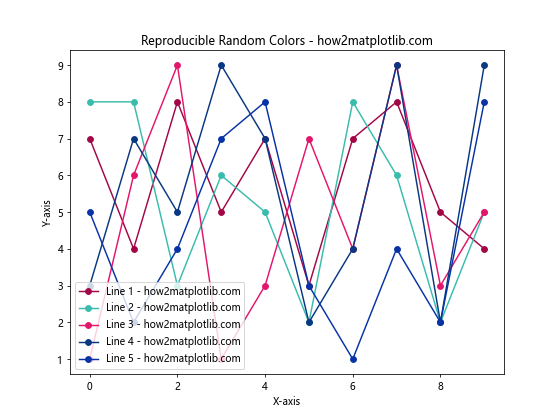
这个示例定义了一个set_random_seed()函数,它同时设置Python的random模块和NumPy的随机种子。通过使用固定的种子值,我们可以确保每次运行代码时生成相同的随机颜色序列。
16. 使用颜色主题
我们可以定义一些颜色主题,并从这些主题中随机选择颜色。这种方法可以确保颜色的协调性。
import matplotlib.pyplot as plt
import random

color_themes = {
    'pastel': ['#FFB3BA', '#BAFFC9', '#BAE1FF', '#FFFFBA', '#FFDFBA'],
    'bold': ['#FF0000', '#00FF00', '#0000FF', '#FFFF00', '#FF00FF'],
    'earth': ['#8B4513', '#556B2F', '#8B8B83', '#D2691E', '#CD853F']
}

plt.figure(figsize=(8, 6))
theme = random.choice(list(color_themes.keys()))
colors = color_themes[theme]

for i, color in enumerate(colors):
    x = range(10)
    y = [random.randint(1, 10) for _ in range(10)]
    plt.bar(x, y, color=color, alpha=0.7, label=f'Bar {i+1} - how2matplotlib.com')

plt.title(f'Random Colors from {theme.capitalize()} Theme - how2matplotlib.com')
plt.xlabel('X-axis')
plt.ylabel('Y-axis')
plt.legend()
plt.show()
Output:
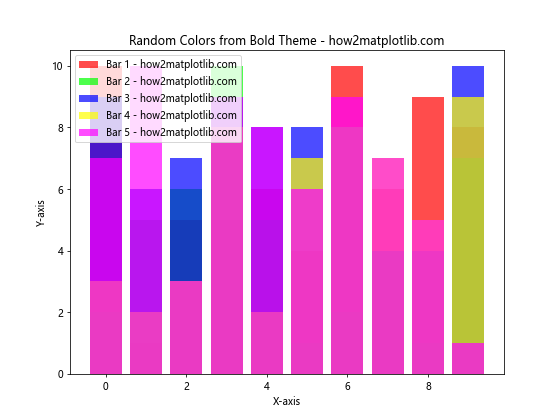
这个例子定义了几个颜色主题,每个主题包含一组协调的颜色。我们随机选择一个主题,并使用其中的颜色来创建图表。
17. 使用颜色插值
我们可以使用颜色插值技术来生成更多的中间颜色。
import matplotlib.pyplot as plt
import numpy as np

def interpolate_colors(color1, color2, num_colors):
    return [np.array(color1) * (1 - t) + np.array(color2) * t for t in np.linspace(0, 1, num_colors)]

plt.figure(figsize=(8, 6))
color1 = (1, 0, 0)  # 红色
color2 = (0, 0, 1)  # 蓝色
num_colors = 10

colors = interpolate_colors(color1, color2, num_colors)

for i, color in enumerate(colors):
    x = range(10)
    y = [i+1] * 10
    plt.plot(x, y, color=color, linewidth=3, label=f'Line {i+1} - how2matplotlib.com')

plt.title('Color Interpolation - how2matplotlib.com')
plt.xlabel('X-axis')
plt.ylabel('Y-axis')
plt.legend()
plt.show()
Output:
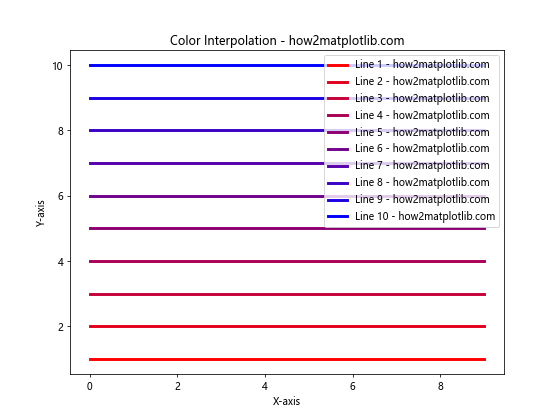
这个示例定义了一个interpolate_colors()函数,它在两种给定颜色之间创建一系列平滑过渡的颜色。这种方法可以用来创建渐变效果或生成更多的颜色选择。
18. 使用颜色亮度调整
我们可以通过调整颜色的亮度来创建一系列相关的颜色。
import matplotlib.pyplot as plt
import colorsys

def adjust_brightness(rgb_color, factor):
    h, s, v = colorsys.rgb_to_hsv(*rgb_color)
    v = max(0, min(1, v * factor))
    return colorsys.hsv_to_rgb(h, s, v)

plt.figure(figsize=(8, 6))
base_color = (0.5, 0.2, 0.7)  # 基础颜色

for i in range(5):
    x = range(10)
    y = [i+1] * 10
    brightness_factor = 0.5 + i * 0.25
    color = adjust_brightness(base_color, brightness_factor)
    plt.plot(x, y, color=color, linewidth=3, label=f'Line {i+1} - how2matplotlib.com')

plt.title('Brightness Adjusted Colors - how2matplotlib.com')
plt.xlabel('X-axis')
plt.ylabel('Y-axis')
plt.legend()
plt.show()
Output:
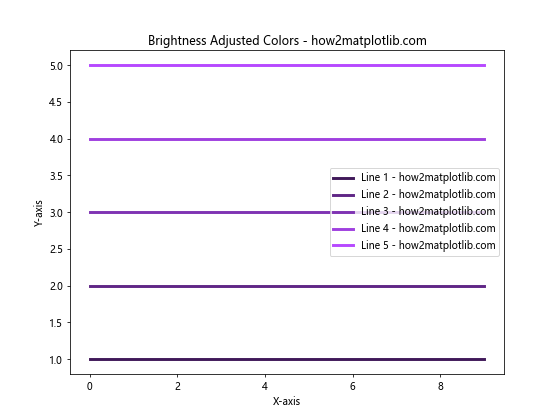
这个例子定义了一个adjust_brightness()函数,它可以调整给定RGB颜色的亮度。我们使用这个函数创建了一系列基于同一基础颜色但亮度不同的颜色。
19. 使用颜色对比度检查
在生成随机颜色时,确保颜色之间有足够的对比度是很重要的,特别是当这些颜色用于文本或重要的图表元素时。
import matplotlib.pyplot as plt
import random
import colorsys

def color_distance(color1, color2):
    return sum((a-b)**2 for a, b in zip(color1, color2))**0.5

def generate_contrasting_color(existing_colors, min_distance=0.3):
    while True:
        new_color = (random.random(), random.random(), random.random())
        if all(color_distance(new_color, color) >= min_distance for color in existing_colors):
            return new_color

plt.figure(figsize=(8, 6))
colors = []

for i in range(5):
    color = generate_contrasting_color(colors)
    colors.append(color)
    x = range(10)
    y = [random.randint(1, 10) for _ in range(10)]
    plt.plot(x, y, color=color, linewidth=2, label=f'Line {i+1} - how2matplotlib.com')

plt.title('Contrasting Random Colors - how2matplotlib.com')
plt.xlabel('X-axis')
plt.ylabel('Y-axis')
plt.legend()
plt.show()
Output:
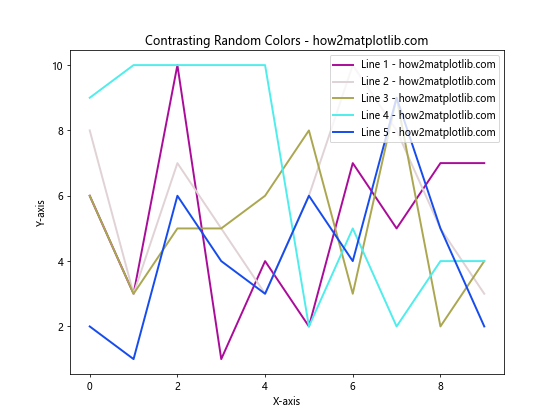
这个示例定义了两个函数:color_distance()用于计算两种颜色之间的欧几里得距离,generate_contrasting_color()生成与现有颜色有足够对比度的新颜色。这确保了图表中的每种颜色都足够独特和可区分。
20. 使用颜色名称生成器
最后,我们可以创建一个颜色名称生成器,它不仅生成随机颜色,还为每种颜色提供一个描述性的名称。
import matplotlib.pyplot as plt
import random

def generate_color_name():
    hues = ['Red', 'Orange', 'Yellow', 'Green', 'Blue', 'Purple', 'Pink']
    modifiers = ['Light', 'Dark', 'Bright', 'Pale', 'Deep']
    return f"{random.choice(modifiers)} {random.choice(hues)}"

plt.figure(figsize=(8, 6))

for i in range(5):
    x = range(10)
    y = [random.randint(1, 10) for _ in range(10)]
    color = (random.random(), random.random(), random.random())
    color_name = generate_color_name()
    plt.plot(x, y, color=color, linewidth=2, label=f'{color_name} - how2matplotlib.com')

plt.title('Random Colors with Names - how2matplotlib.com')
plt.xlabel('X-axis')
plt.ylabel('Y-axis')
plt.legend()
plt.show()
Output:
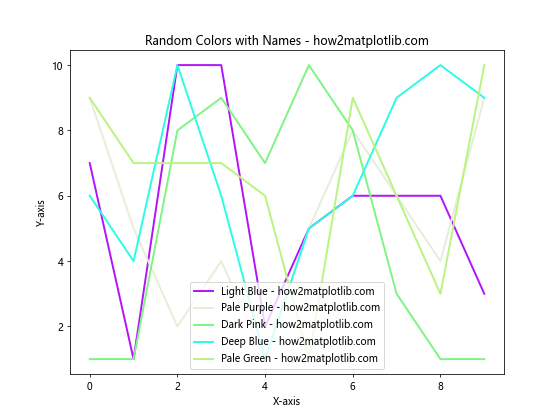
这个例子定义了一个generate_color_name()函数,它随机组合色调和修饰词来创建颜色名称。虽然这些名称并不精确对应生成的RGB颜色,但它们为每种颜色提供了一个有趣和描述性的标签。
结论
在Matplotlib中生成随机颜色是一个既简单又强大的技术,可以大大增强数据可视化的吸引力和效果。本文介绍了多种方法,从基本的随机RGB值生成到更复杂的技术,如使用颜色空间、颜色映射、渐变和主题。这些方法可以根据具体需求灵活运用,以创建出独特、协调和有意义的颜色方案。
在实际应用中,选择合适的随机颜色生成方法取决于多个因素,包括数据的性质、可视化的目的、以及目标受众。例如,在科学论文中,可能需要使用更加保守和专业的颜色方案;而在创意项目或信息图表中,则可以使用更加大胆和丰富的颜色。
此外,在使用随机颜色时,还需要考虑以下几点:
- 可读性:确保生成的颜色不会影响图表的可读性。特别是当颜色用于文本或小型图形元素时,要注意保持足够的对比度。
-
色盲友好:考虑使用对色盲人士友好的颜色方案,避免仅依赖于红绿对比的颜色组合。
-
一致性:在同一个项目或报告中,保持颜色使用的一致性。可以考虑创建一个自定义的颜色生成函数,并在整个项目中重复使用。
-
文化因素:在国际化项目中,要注意不同文化对颜色的不同解读。某些颜色在不同文化背景下可能有不同的含义或关联。
-
打印兼容性:如果图表需要打印,确保选择的颜色在打印时仍然清晰可辨。
-
性能考虑:在处理大量数据点时,生成和应用随机颜色可能会影响性能。在这种情况下,可以考虑预生成一组颜色并循环使用。
-
版权和品牌指南:在商业项目中,确保生成的颜色不会侵犯任何现有的商标或违反品牌指南。
通过掌握这些技术和考虑因素,你可以在Matplotlib中创建出既美观又有效的数据可视化。随机颜色的使用不仅可以增加图表的视觉吸引力,还可以帮助区分不同的数据系列,突出关键信息,甚至传达额外的数据维度。
最后,值得注意的是,虽然随机颜色生成是一个强大的工具,但它并不适用于所有情况。在某些场景下,精心选择的固定颜色方案可能更为合适。因此,在决定使用随机颜色之前,务必考虑你的具体需求和目标受众。
通过实践和经验,你将能够更好地判断何时以及如何使用随机颜色,从而创造出既专业又富有创意的数据可视化作品。随着数据可视化在各个领域的重要性不断增加,掌握这些技能将使你在数据分析、科学研究、商业报告等多个方面都能脱颖而出。
总之,Matplotlib提供了丰富的工具和选项来生成和使用随机颜色。通过结合本文介绍的各种方法,你可以创建出独特、吸引人且信息丰富的图表。无论你是数据科学家、研究人员、还是设计师,这些技巧都将帮助你更好地展示数据,讲述数据背后的故事。继续探索和实验不同的颜色生成技术,你会发现更多创新的方式来增强你的数据可视化作品。
 极客教程
极客教程