如何在Python中导出带透明背景的Matplotlib图表
参考:How to Export Matplotlib Plot with Transparent Background in Python
Matplotlib是Python中最流行的数据可视化库之一,它提供了丰富的绘图功能和灵活的自定义选项。在数据可视化和科学绘图中,有时我们需要导出带有透明背景的图表,以便更好地与其他图像或文档集成。本文将详细介绍如何在Python中使用Matplotlib创建和导出带透明背景的图表,包括各种图表类型和导出格式的示例。
1. 透明背景的重要性
在许多情况下,透明背景对于图表的展示和集成至关重要:
- 文档集成:当将图表嵌入到文档、幻灯片或网页中时,透明背景可以确保图表与背景无缝融合。
- 叠加效果:透明背景允许将多个图表或图像叠加,创造出复杂的视觉效果。
- 设计灵活性:透明背景为后期编辑和设计提供了更大的灵活性。
- 专业外观:透明背景通常能让图表看起来更加专业和精致。
2. 基本概念和设置
在开始创建透明背景的图表之前,我们需要了解一些基本概念和设置:
2.1 Figure和Axes
在Matplotlib中,Figure是整个图形窗口,而Axes是图形中的绘图区域。我们可以通过设置Figure的背景透明来实现整个图表的透明效果。
2.2 DPI(每英寸点数)
DPI决定了导出图像的分辨率。较高的DPI值会产生更高质量的图像,但文件大小也会相应增加。
2.3 透明度值
透明度通常用alpha值表示,范围从0(完全透明)到1(完全不透明)。
让我们从一个基本的示例开始:
import matplotlib.pyplot as plt

# 创建一个新的Figure和Axes
fig, ax = plt.subplots()

# 绘制一条简单的线
ax.plot([0, 1, 2, 3, 4], [0, 2, 1, 3, 2], label='how2matplotlib.com')

# 添加标题和标签
ax.set_title('Transparent Background Example')
ax.set_xlabel('X-axis')
ax.set_ylabel('Y-axis')
ax.legend()

# 设置Figure的背景透明
fig.patch.set_alpha(0.0)

# 保存图表为PNG格式,设置透明背景
plt.savefig('transparent_plot.png', transparent=True, dpi=300)

plt.show()
Output:
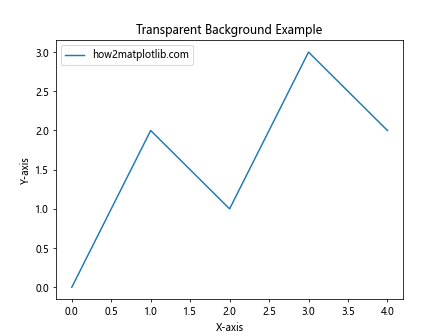
在这个例子中,我们创建了一个简单的线图,并通过设置fig.patch.set_alpha(0.0)使Figure的背景透明。在保存图表时,我们使用transparent=True参数确保背景透明,并设置dpi=300以获得高质量的输出。
3. 不同类型图表的透明背景设置
接下来,我们将探讨如何为不同类型的图表设置透明背景。
3.1 散点图
散点图是展示两个变量之间关系的常用图表类型。以下是创建带透明背景的散点图的示例:
import matplotlib.pyplot as plt
import numpy as np

# 生成随机数据
np.random.seed(42)
x = np.random.rand(50)
y = np.random.rand(50)

# 创建散点图
fig, ax = plt.subplots()
ax.scatter(x, y, alpha=0.5, label='how2matplotlib.com')

ax.set_title('Transparent Scatter Plot')
ax.set_xlabel('X-axis')
ax.set_ylabel('Y-axis')
ax.legend()

# 设置Figure的背景透明
fig.patch.set_alpha(0.0)

# 保存图表为PNG格式,设置透明背景
plt.savefig('transparent_scatter.png', transparent=True, dpi=300)

plt.show()
Output:
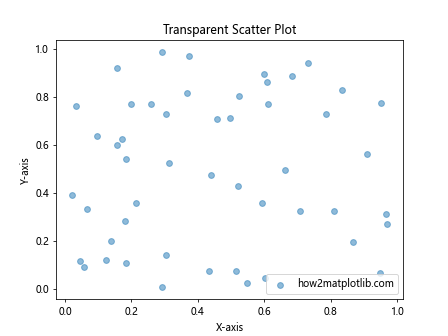
在这个例子中,我们使用plt.scatter()函数创建散点图,并通过alpha=0.5设置点的透明度。图表的背景透明度通过fig.patch.set_alpha(0.0)设置。
3.2 柱状图
柱状图用于比较不同类别的数值。以下是创建带透明背景的柱状图的示例:
import matplotlib.pyplot as plt

categories = ['A', 'B', 'C', 'D']
values = [3, 7, 2, 5]

fig, ax = plt.subplots()
ax.bar(categories, values, alpha=0.7, label='how2matplotlib.com')

ax.set_title('Transparent Bar Chart')
ax.set_xlabel('Categories')
ax.set_ylabel('Values')
ax.legend()

# 设置Figure的背景透明
fig.patch.set_alpha(0.0)

# 保存图表为PNG格式,设置透明背景
plt.savefig('transparent_bar.png', transparent=True, dpi=300)

plt.show()
Output:
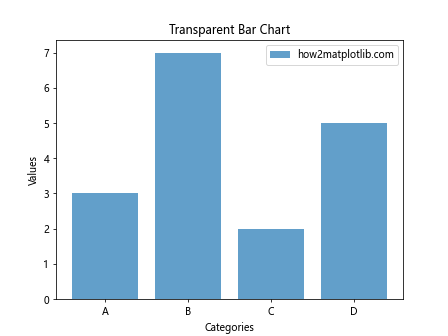
在这个例子中,我们使用plt.bar()函数创建柱状图,并通过alpha=0.7设置柱子的透明度。背景透明度的设置方法与之前相同。
3.3 饼图
饼图用于展示各部分占整体的比例。以下是创建带透明背景的饼图的示例:
import matplotlib.pyplot as plt

sizes = [30, 25, 20, 15, 10]
labels = ['A', 'B', 'C', 'D', 'E']

fig, ax = plt.subplots()
ax.pie(sizes, labels=labels, autopct='%1.1f%%', startangle=90, label='how2matplotlib.com')

ax.set_title('Transparent Pie Chart')

# 设置Figure的背景透明
fig.patch.set_alpha(0.0)

# 保存图表为PNG格式,设置透明背景
plt.savefig('transparent_pie.png', transparent=True, dpi=300)

plt.show()
在这个例子中,我们使用plt.pie()函数创建饼图。饼图本身不需要设置透明度,但我们仍然通过fig.patch.set_alpha(0.0)设置Figure的背景透明。
3.4 热力图
热力图用于可视化矩阵数据,通常用颜色来表示数值的大小。以下是创建带透明背景的热力图的示例:
import matplotlib.pyplot as plt
import numpy as np

# 生成随机数据
data = np.random.rand(10, 10)

fig, ax = plt.subplots()
im = ax.imshow(data, cmap='viridis')

ax.set_title('Transparent Heatmap')
fig.colorbar(im, ax=ax, label='how2matplotlib.com')

# 设置Figure的背景透明
fig.patch.set_alpha(0.0)

# 保存图表为PNG格式,设置透明背景
plt.savefig('transparent_heatmap.png', transparent=True, dpi=300)

plt.show()
Output:
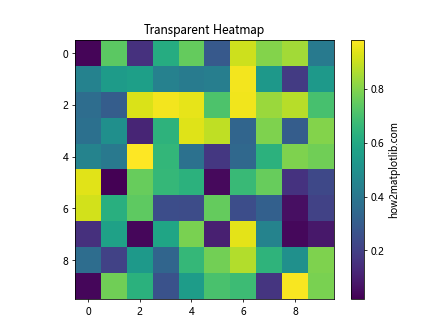
在这个例子中,我们使用plt.imshow()函数创建热力图。热力图本身不透明,但我们通过设置Figure的背景透明来实现整体的透明效果。
4. 高级透明背景技巧
除了基本的透明背景设置,还有一些高级技巧可以帮助我们创建更复杂和精美的透明背景图表。
4.1 部分透明
有时,我们可能希望图表背景只是部分透明,而不是完全透明。我们可以通过调整alpha值来实现这一点:
import matplotlib.pyplot as plt
import numpy as np

x = np.linspace(0, 10, 100)
y = np.sin(x)

fig, ax = plt.subplots()
ax.plot(x, y, label='how2matplotlib.com')

ax.set_title('Partially Transparent Background')
ax.set_xlabel('X-axis')
ax.set_ylabel('Y-axis')
ax.legend()

# 设置Figure的背景部分透明
fig.patch.set_alpha(0.5)

# 保存图表为PNG格式,设置透明背景
plt.savefig('partially_transparent.png', transparent=True, dpi=300)

plt.show()
Output:
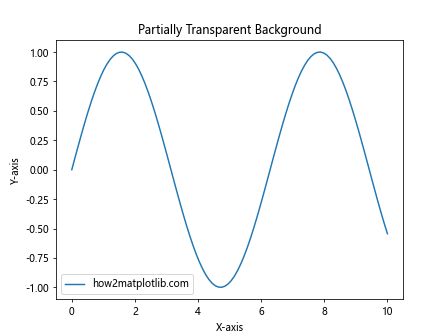
在这个例子中,我们将Figure的背景透明度设置为0.5,创建了一个半透明的效果。
4.2 渐变透明背景
我们还可以创建渐变透明背景,为图表添加更多视觉吸引力:
import matplotlib.pyplot as plt
import numpy as np
from matplotlib.colors import LinearSegmentedColormap

# 创建渐变透明颜色映射
colors = [(1, 1, 1, 0), (1, 1, 1, 1)]  # 从透明白到不透明白
n_bins = 100
cmap = LinearSegmentedColormap.from_list('custom', colors, N=n_bins)

# 创建渐变背景
x = np.linspace(0, 10, 100)
y = np.linspace(0, 10, 100)
X, Y = np.meshgrid(x, y)
Z = X + Y

fig, ax = plt.subplots()
im = ax.imshow(Z, cmap=cmap, extent=[0, 10, 0, 10])

# 绘制一条线
ax.plot([0, 10], [0, 10], 'r-', label='how2matplotlib.com')

ax.set_title('Gradient Transparent Background')
ax.set_xlabel('X-axis')
ax.set_ylabel('Y-axis')
ax.legend()

# 保存图表为PNG格式,设置透明背景
plt.savefig('gradient_transparent.png', transparent=True, dpi=300)

plt.show()
Output:
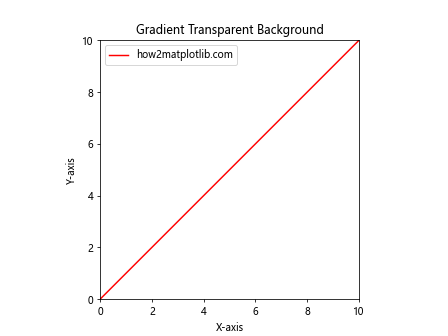
在这个例子中,我们创建了一个从透明到不透明的渐变白色背景,并在其上绘制了一条红线。
4.3 多子图透明背景
当我们需要在一个Figure中创建多个子图时,可以为每个子图单独设置透明背景:
import matplotlib.pyplot as plt
import numpy as np

fig, (ax1, ax2) = plt.subplots(1, 2, figsize=(12, 5))

# 子图1:散点图
x = np.random.rand(50)
y = np.random.rand(50)
ax1.scatter(x, y, alpha=0.5)
ax1.set_title('Scatter Plot')
ax1.set_xlabel('X-axis')
ax1.set_ylabel('Y-axis')

# 子图2:柱状图
categories = ['A', 'B', 'C', 'D']
values = [3, 7, 2, 5]
ax2.bar(categories, values, alpha=0.7)
ax2.set_title('Bar Chart')
ax2.set_xlabel('Categories')
ax2.set_ylabel('Values')

# 设置Figure的背景透明
fig.patch.set_alpha(0.0)

# 设置每个子图的背景透明
ax1.patch.set_alpha(0.0)
ax2.patch.set_alpha(0.0)

plt.suptitle('Multiple Subplots with Transparent Background', fontsize=16)

# 添加水印
fig.text(0.5, 0.02, 'how2matplotlib.com', ha='center', va='center', alpha=0.5)

# 保存图表为PNG格式,设置透明背景
plt.savefig('multi_subplot_transparent.png', transparent=True, dpi=300)

plt.show()
Output:
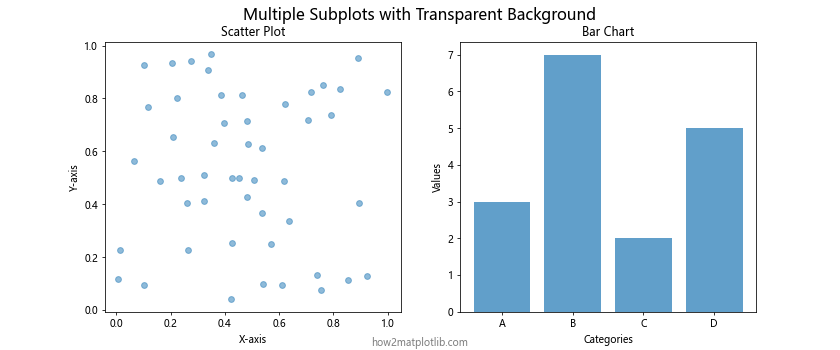
在这个例子中,我们创建了两个子图,分别是散点图和柱状图。我们不仅设置了Figure的背景透明,还单独设置了每个子图的背景透明。
5. 不同文件格式的透明背景导出
Matplotlib支持多种文件格式的导出,但并非所有格式都支持透明背景。以下是一些常用格式的透明背景支持情况:
5.1 PNG格式
PNG(Portable Network Graphics)是最常用的支持透明背景的图像格式之一。以下是导出PNG格式的示例:
import matplotlib.pyplot as plt
import numpy as np

x = np.linspace(0, 10, 100)
y = np.sin(x)

fig, ax = plt.subplots()
ax.plot(x, y, label='how2matplotlib.com')

ax.set_title('PNG with Transparent Background')
ax.set_xlabel('X-axis')
ax.set_ylabel('Y-axis')
ax.legend()

# 设置Figure的背景透明
fig.patch.set_alpha(0.0)

# 保存为PNG格式,设置透明背景
plt.savefig('transparent_plot.png', transparent=True, dpi=300)

plt.show()
Output:
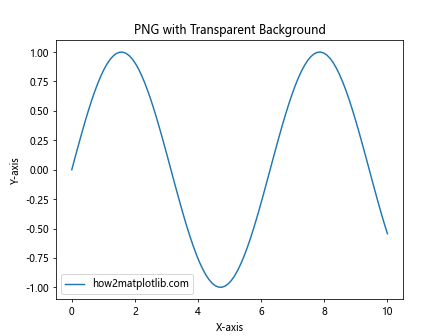
PNG格式完全支持透明背景,是导出带透明背景图表的理想选择。
5.2 SVG格式
SVG(Scalable Vector Graphics)是一种矢量图形格式,也支持透明背景。以下是导出SVG格式的示例:
import matplotlib.pyplot as plt
import numpy as np

x = np.linspace(0, 10, 100)
y = np.cos(x)

fig, ax = plt.subplots()
ax.plot(x, y, label='how2matplotlib.com')

ax.set_title('SVG with Transparent Background')
ax.set_xlabel('X-axis')
ax.set_ylabel('Y-axis')
ax.legend()

# 设置Figure的背景透明
fig.patch.set_alpha(0.0)

# 保存为SVG格式,设置透明背景
plt.savefig('transparent_plot.svg', transparent=True)

plt.show()
Output:
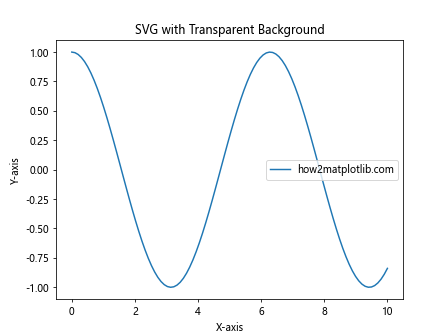
SVG格式不仅支持透明背景,还能保持图像的清晰度,适合需要在不同缩放级别下保持高质量的场景。
5.3 PDF格式
PDF(Portable Document Format)也支持透明背景,适合用于文档嵌入。以下是导出PDF格式的示例:
import matplotlib.pyplot as plt
import numpy as np

x = np.linspace(0, 10, 100)
y = np.tan(x)

fig, ax = plt.subplots()
ax.plot(x, y, label='how2matplotlib.com')

ax.set_title('PDF with Transparent Background')
ax.set_xlabel('X-axis')
ax.set_ylabel('Y-axis')
ax.legend()

# 设置Figure的背景透明
fig.patch.set_alpha(0.0)

# 保存为PDF格式,设置透明背景
plt.savefig('transparent_plot.pdf', transparent=True)

plt.show()
Output:
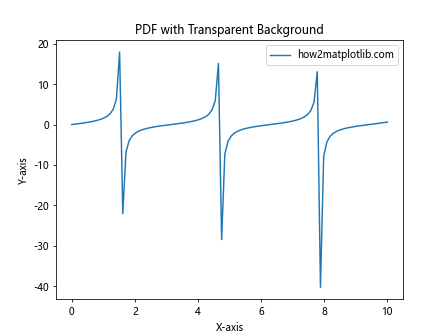
PDF格式支持透明背景,并且可以保持图表的矢量特性,适合用于高质量打印和文档嵌入。
5.4 TIFF格式
TIFF(Tagged Image File Format)是一种灵活的图像格式,也支持透明背景。以下是导出TIFF格式的示例:
import matplotlib.pyplot as plt
import numpy as np

x = np.linspace(0, 10, 100)
y = np.exp(x)

fig, ax = plt.subplots()
ax.plot(x, y, label='how2matplotlib.com')

ax.set_title('TIFF with Transparent Background')
ax.set_xlabel('X-axis')
ax.set_ylabel('Y-axis')
ax.legend()

# 设置Figure的背景透明
fig.patch.set_alpha(0.0)

# 保存为TIFF格式,设置透明背景
plt.savefig('transparent_plot.tiff', transparent=True, dpi=300)

plt.show()
Output:
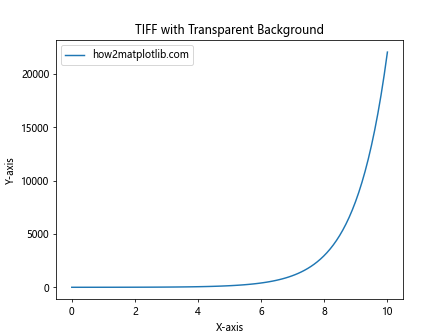
TIFF格式支持透明背景,并且可以保存高质量的图像,适合用于专业图像处理和印刷。
6. 常见问题和解决方案
在创建和导出带透明背景的Matplotlib图表时,可能会遇到一些常见问题。以下是一些问题及其解决方案:
6.1 背景不透明
如果保存的图表背景仍然不透明,请检查以下几点:
- 确保在
savefig()函数中设置了transparent=True参数。 - 检查是否正确设置了
fig.patch.set_alpha(0.0)。 - 确保使用支持透明背景的文件格式(如PNG、SVG)。
示例代码:
import matplotlib.pyplot as plt
import numpy as np

x = np.linspace(0, 10, 100)
y = np.sin(x) * np.exp(-x/10)

fig, ax = plt.subplots()
ax.plot(x, y, label='how2matplotlib.com')

ax.set_title('Troubleshooting Transparent Background')
ax.set_xlabel('X-axis')
ax.set_ylabel('Y-axis')
ax.legend()

# 确保设置Figure的背景透明
fig.patch.set_alpha(0.0)

# 保存图表,确保设置transparent=True
plt.savefig('troubleshoot_transparent.png', transparent=True, dpi=300)

plt.show()
Output:
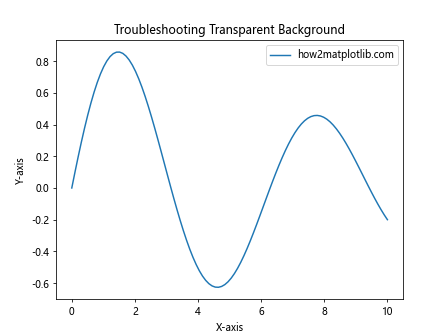
6.2 图表元素意外透明
有时,设置背景透明可能会导致图表中的某些元素意外变透明。解决这个问题的方法是单独设置这些元素的透明度:
import matplotlib.pyplot as plt
import numpy as np

x = np.linspace(0, 10, 100)
y1 = np.sin(x)
y2 = np.cos(x)

fig, ax = plt.subplots()
ax.plot(x, y1, label='Sin', color='blue', alpha=1.0)
ax.plot(x, y2, label='Cos', color='red', alpha=1.0)

ax.set_title('Fixing Unintended Transparency', alpha=1.0)
ax.set_xlabel('X-axis', alpha=1.0)
ax.set_ylabel('Y-axis', alpha=1.0)
ax.legend(framealpha=1.0)

# 设置Figure的背景透明
fig.patch.set_alpha(0.0)

# 设置Axes的背景透明,但保持其他元素不透明
ax.patch.set_alpha(0.0)

plt.savefig('fixed_transparency.png', transparent=True, dpi=300)

plt.show()
Output:
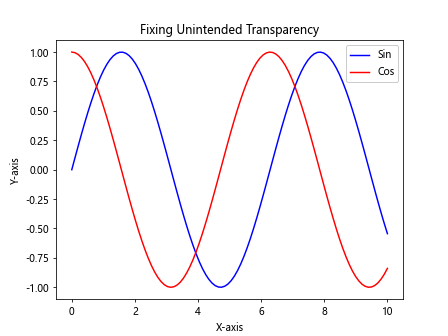
在这个例子中,我们为每个图表元素单独设置了alpha=1.0,确保它们保持完全不透明。
6.3 文件大小过大
有时,导出的透明背景图表文件可能会比预期的大。解决这个问题的方法包括:
- 降低DPI值(但要注意保持图像质量)。
- 使用更高效的图像格式,如PNG而不是TIFF。
- 减少图表中的数据点或简化图表。
示例代码:
import matplotlib.pyplot as plt
import numpy as np

x = np.linspace(0, 10, 50)  # 减少数据点
y = np.sin(x)

fig, ax = plt.subplots(figsize=(6, 4))  # 减小图表尺寸
ax.plot(x, y, label='how2matplotlib.com')

ax.set_title('Optimized File Size')
ax.set_xlabel('X-axis')
ax.set_ylabel('Y-axis')
ax.legend()

# 设置Figure的背景透明
fig.patch.set_alpha(0.0)

# 保存图表,使用较低的DPI值
plt.savefig('optimized_transparent.png', transparent=True, dpi=150)

plt.show()
Output:
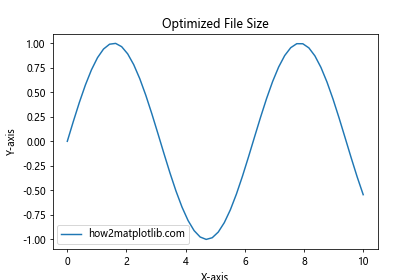
7. 高级应用
除了基本的透明背景设置,Matplotlib还提供了一些高级功能,可以创建更复杂和精美的透明背景图表。
7.1 自定义透明图案背景
我们可以创建自定义的透明图案作为背景,为图表添加独特的视觉效果:
import matplotlib.pyplot as plt
import numpy as np
from matplotlib.patches import Rectangle

def create_pattern(ax, pattern_func, num_rows=10, num_cols=10):
    for i in range(num_rows):
        for j in range(num_cols):
            pattern_func(ax, i, j)

def diamond_pattern(ax, i, j):
    rect = Rectangle((j, i), 0.5, 0.5, fill=False, ec='lightgray', alpha=0.5)
    ax.add_patch(rect)
    rect = Rectangle((j+0.5, i+0.5), 0.5, 0.5, fill=False, ec='lightgray', alpha=0.5)
    ax.add_patch(rect)

x = np.linspace(0, 10, 100)
y = np.sin(x)

fig, ax = plt.subplots(figsize=(10, 6))

# 创建自定义透明图案背景
create_pattern(ax, diamond_pattern)

ax.plot(x, y, 'r-', linewidth=2, label='how2matplotlib.com')

ax.set_title('Custom Transparent Pattern Background')
ax.set_xlabel('X-axis')
ax.set_ylabel('Y-axis')
ax.legend()

# 设置Figure的背景透明
fig.patch.set_alpha(0.0)

plt.savefig('custom_pattern_transparent.png', transparent=True, dpi=300)

plt.show()
Output:
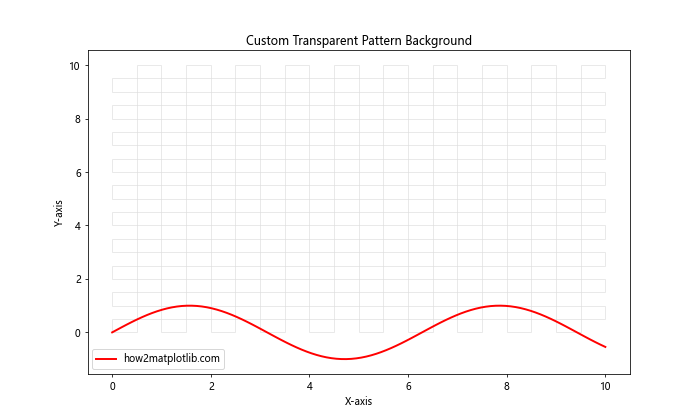
这个例子创建了一个钻石形状的透明图案作为背景,为图表添加了独特的视觉效果。
7.2 透明水印
我们可以为图表添加透明水印,以保护图表版权或添加额外信息:
import matplotlib.pyplot as plt
import numpy as np

x = np.linspace(0, 10, 100)
y = np.cos(x)

fig, ax = plt.subplots(figsize=(10, 6))
ax.plot(x, y, label='how2matplotlib.com')

ax.set_title('Transparent Watermark Example')
ax.set_xlabel('X-axis')
ax.set_ylabel('Y-axis')
ax.legend()

# 添加透明水印
fig.text(0.5, 0.5, 'how2matplotlib.com', fontsize=40, color='gray',
         ha='center', va='center', alpha=0.2, rotation=30)

# 设置Figure的背景透明
fig.patch.set_alpha(0.0)

plt.savefig('watermark_transparent.png', transparent=True, dpi=300)

plt.show()
Output:
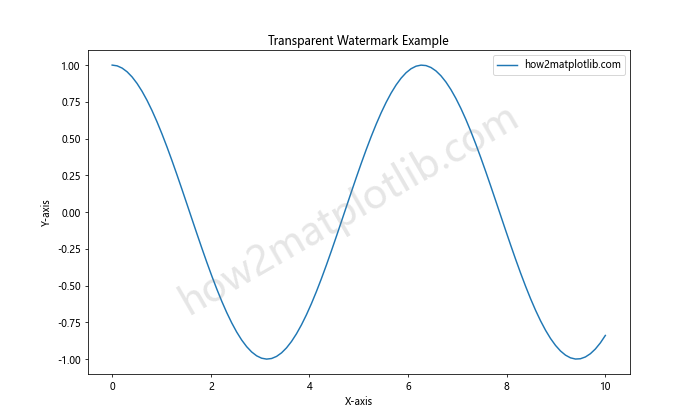
这个例子在图表中心添加了一个半透明的水印文本。
7.3 透明度动画
我们还可以创建透明度随时间变化的动画图表:
import matplotlib.pyplot as plt
import numpy as np
from matplotlib.animation import FuncAnimation

fig, ax = plt.subplots()
x = np.linspace(0, 2*np.pi, 100)
line, = ax.plot(x, np.sin(x), label='how2matplotlib.com')

ax.set_title('Transparency Animation')
ax.set_xlabel('X-axis')
ax.set_ylabel('Y-axis')
ax.legend()

# 设置Figure的背景透明
fig.patch.set_alpha(0.0)

def update(frame):
    line.set_alpha(np.abs(np.sin(frame/10)))
    return line,

ani = FuncAnimation(fig, update, frames=100, interval=50, blit=True)

# 保存动画
ani.save('transparency_animation.gif', writer='pillow', transparent=True)

plt.show()
这个例子创建了一个正弦波图表,其透明度随时间周期性变化。
8. 结论
在Python中使用Matplotlib创建和导出带透明背景的图表是一项强大而灵活的技能。通过本文介绍的各种技巧和示例,你应该能够轻松地为各种类型的图表设置透明背景,并解决可能遇到的常见问题。
记住以下关键点:
- 使用
fig.patch.set_alpha(0.0)设置Figure的背景透明。 - 在保存图表时,使用
transparent=True参数。 - 选择支持透明背景的文件格式,如PNG、SVG或PDF。
- 根据需要调整各个图表元素的透明度。
- 考虑使用高级技巧,如自定义透明图案或水印,以增强图表的视觉效果和功能性。
通过掌握这些技巧,你可以创建出既美观又实用的透明背景图表,为你的数据可视化项目增添专业感和灵活性。无论是用于学术论文、商业报告还是网页设计,透明背景图表都能为你的作品锦上添花。
 极客教程
极客教程