如何在Python的Matplotlib图形中将小数点更改为逗号
参考:How to Change Point to Comma in Matplotlib Graphics in Python
Matplotlib是Python中最流行的数据可视化库之一,它提供了丰富的绘图功能和自定义选项。在使用Matplotlib创建图形时,有时我们需要根据特定的地区或语言习惯来调整数字的显示格式。其中一个常见的需求是将小数点更改为逗号,这在某些国家和地区的数字表示中很常见。本文将详细介绍如何在Matplotlib图形中实现这一需求,并提供多个实用的示例代码。
1. 理解Matplotlib中的数字格式化
在深入探讨如何更改小数点为逗号之前,我们需要先了解Matplotlib中的数字格式化机制。Matplotlib使用一个称为Locator和Formatter的系统来控制坐标轴上的刻度和标签。
- Locator决定在坐标轴上放置刻度的位置
- Formatter控制这些刻度的标签如何显示
对于我们的需求,我们主要关注Formatter,因为它负责控制数字的显示格式。
让我们从一个基本的示例开始:
import matplotlib.pyplot as plt
import numpy as np

x = np.linspace(0, 10, 100)
y = np.sin(x)

plt.figure(figsize=(10, 6))
plt.plot(x, y, label='Sin(x) - how2matplotlib.com')
plt.title('Basic Plot - how2matplotlib.com')
plt.xlabel('X axis')
plt.ylabel('Y axis')
plt.legend()
plt.show()
Output:
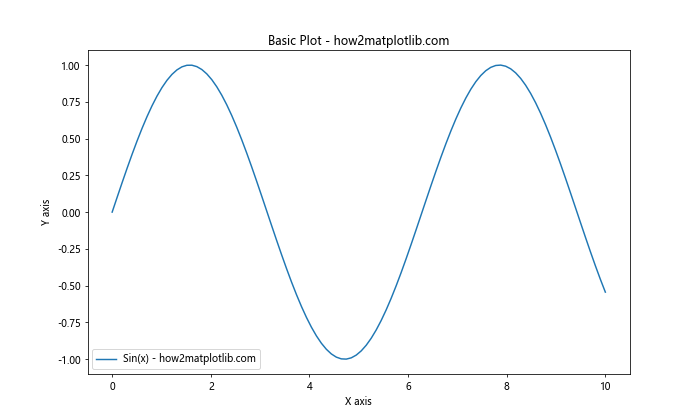
这个示例创建了一个简单的正弦波图。注意,默认情况下,小数点使用的是点号(.)。
2. 使用locale设置全局数字格式
一种改变数字格式的方法是使用Python的locale模块。这种方法可以全局地改变数字的显示方式,不仅仅是在Matplotlib中。
import matplotlib.pyplot as plt
import numpy as np
import locale

# 设置locale为使用逗号的地区,例如德国
locale.setlocale(locale.LC_ALL, 'de_DE.utf8')

x = np.linspace(0, 10, 100)
y = np.sin(x)

plt.figure(figsize=(10, 6))
plt.plot(x, y, label='Sin(x) - how2matplotlib.com')
plt.title('Plot with German Locale - how2matplotlib.com')
plt.xlabel('X axis')
plt.ylabel('Y axis')
plt.legend()
plt.show()
Output:
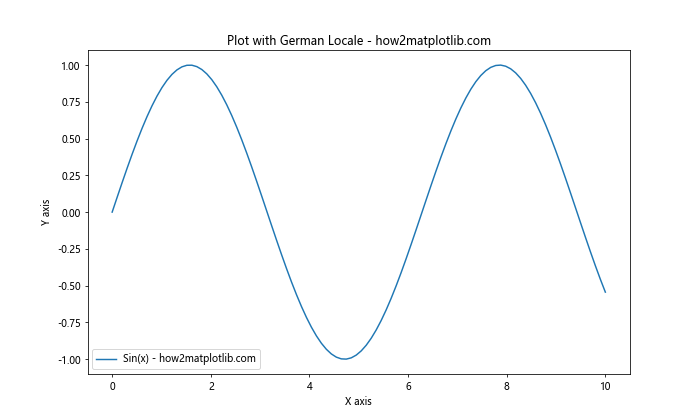
在这个例子中,我们将locale设置为德国(’de_DE.utf8’),这会使用逗号作为小数分隔符。注意,这种方法需要你的系统支持相应的locale设置。
3. 使用ScalarFormatter自定义数字格式
如果你只想在特定的图表中更改数字格式,而不影响全局设置,可以使用Matplotlib的ScalarFormatter类。
import matplotlib.pyplot as plt
import numpy as np
from matplotlib.ticker import ScalarFormatter

class CommaFormatter(ScalarFormatter):
    def __init__(self, *args, **kwargs):
        super().__init__(*args, **kwargs)
        self.set_scientific(False)

    def _set_format(self):
        self.format = lambda x, pos: f"{x:,.3f}".replace(',', ' ').replace('.', ',')

x = np.linspace(0, 10, 100)
y = np.sin(x)

fig, ax = plt.subplots(figsize=(10, 6))
ax.plot(x, y, label='Sin(x) - how2matplotlib.com')
ax.set_title('Plot with Custom Formatter - how2matplotlib.com')
ax.set_xlabel('X axis')
ax.set_ylabel('Y axis')

formatter = CommaFormatter()
ax.yaxis.set_major_formatter(formatter)

plt.legend()
plt.show()
在这个例子中,我们创建了一个自定义的CommaFormatter类,它继承自ScalarFormatter。我们重写了_set_format方法来使用逗号作为小数分隔符。
4. 使用FuncFormatter进行更灵活的格式化
对于更复杂的格式化需求,我们可以使用FuncFormatter。这允许我们定义一个自定义函数来格式化数字。
import matplotlib.pyplot as plt
import numpy as np
from matplotlib.ticker import FuncFormatter

def comma_formatter(x, pos):
    return f"{x:.3f}".replace('.', ',')

x = np.linspace(0, 10, 100)
y = np.sin(x)

fig, ax = plt.subplots(figsize=(10, 6))
ax.plot(x, y, label='Sin(x) - how2matplotlib.com')
ax.set_title('Plot with FuncFormatter - how2matplotlib.com')
ax.set_xlabel('X axis')
ax.set_ylabel('Y axis')

formatter = FuncFormatter(comma_formatter)
ax.yaxis.set_major_formatter(formatter)

plt.legend()
plt.show()
Output:
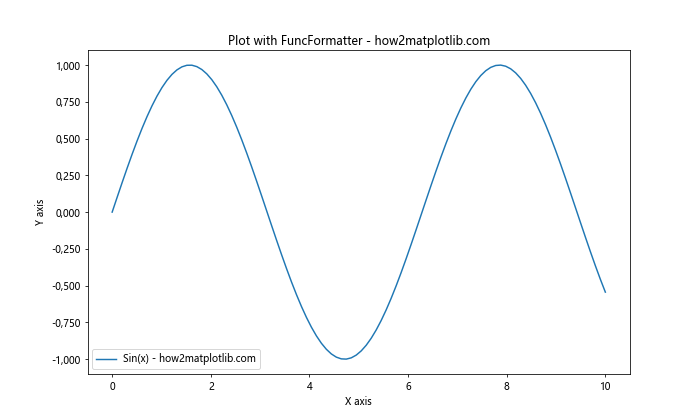
在这个例子中,我们定义了一个comma_formatter函数,它将小数点替换为逗号。然后我们使用FuncFormatter将这个函数应用到y轴上。
5. 在柱状图中应用逗号格式
柱状图是另一种常见的图表类型,我们也可以在其中应用逗号格式。
import matplotlib.pyplot as plt
import numpy as np
from matplotlib.ticker import FuncFormatter

def comma_formatter(x, pos):
    return f"{x:.2f}".replace('.', ',')

categories = ['A', 'B', 'C', 'D', 'E']
values = [3.14, 2.71, 1.41, 0.58, 2.24]

fig, ax = plt.subplots(figsize=(10, 6))
bars = ax.bar(categories, values)

ax.set_title('Bar Chart with Comma Formatter - how2matplotlib.com')
ax.set_xlabel('Categories')
ax.set_ylabel('Values')

formatter = FuncFormatter(comma_formatter)
ax.yaxis.set_major_formatter(formatter)

# 在柱子上添加数值标签
for bar in bars:
    height = bar.get_height()
    ax.text(bar.get_x() + bar.get_width()/2., height,
            f'{height:.2f}'.replace('.', ','),
            ha='center', va='bottom')

plt.show()
Output:
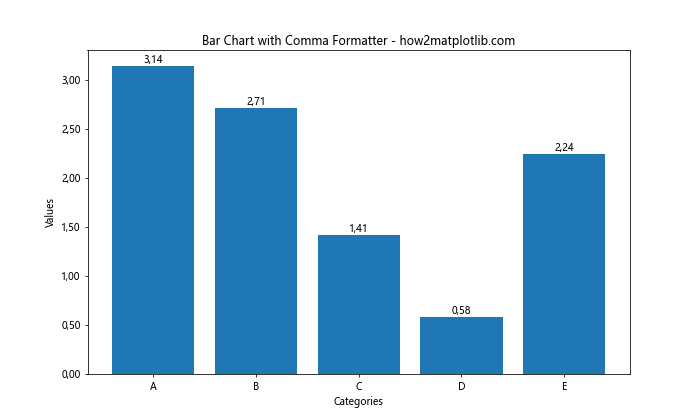
这个例子展示了如何在柱状图中应用逗号格式,不仅在y轴上,还在柱子顶部的数值标签中。
6. 在散点图中使用逗号格式
散点图是另一种常用的图表类型,我们同样可以应用逗号格式。
import matplotlib.pyplot as plt
import numpy as np
from matplotlib.ticker import FuncFormatter

def comma_formatter(x, pos):
    return f"{x:.2f}".replace('.', ',')

np.random.seed(42)
x = np.random.rand(50) * 10
y = np.random.rand(50) * 10

fig, ax = plt.subplots(figsize=(10, 6))
scatter = ax.scatter(x, y, c=y, cmap='viridis', label='Data Points - how2matplotlib.com')

ax.set_title('Scatter Plot with Comma Formatter - how2matplotlib.com')
ax.set_xlabel('X axis')
ax.set_ylabel('Y axis')

formatter = FuncFormatter(comma_formatter)
ax.xaxis.set_major_formatter(formatter)
ax.yaxis.set_major_formatter(formatter)

plt.colorbar(scatter)
plt.legend()
plt.show()
Output:
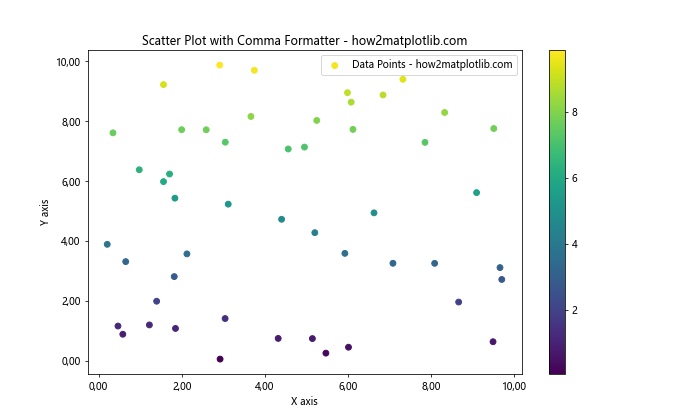
在这个散点图例子中,我们将逗号格式应用到了x轴和y轴。同时,我们还添加了一个颜色条来表示y值的大小。
7. 在多子图中应用逗号格式
当我们需要创建包含多个子图的复杂图表时,我们可能希望在所有子图中统一使用逗号格式。
import matplotlib.pyplot as plt
import numpy as np
from matplotlib.ticker import FuncFormatter

def comma_formatter(x, pos):
    return f"{x:.2f}".replace('.', ',')

x = np.linspace(0, 10, 100)
y1 = np.sin(x)
y2 = np.cos(x)
y3 = np.tan(x)
y4 = x**2

fig, ((ax1, ax2), (ax3, ax4)) = plt.subplots(2, 2, figsize=(12, 10))
fig.suptitle('Multiple Subplots with Comma Formatter - how2matplotlib.com')

axes = [ax1, ax2, ax3, ax4]
data = [(x, y1, 'Sin(x)'), (x, y2, 'Cos(x)'), (x, y3, 'Tan(x)'), (x, y4, 'x^2')]

for ax, (x, y, title) in zip(axes, data):
    ax.plot(x, y, label=f'{title} - how2matplotlib.com')
    ax.set_title(title)
    ax.legend()

    formatter = FuncFormatter(comma_formatter)
    ax.xaxis.set_major_formatter(formatter)
    ax.yaxis.set_major_formatter(formatter)

plt.tight_layout()
plt.show()
Output:
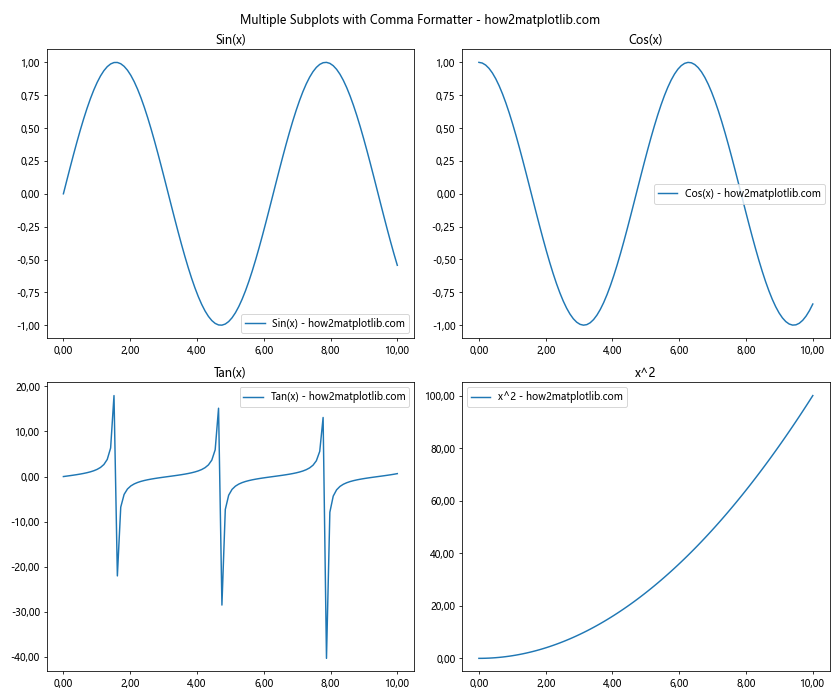
这个例子展示了如何在包含四个子图的图表中统一应用逗号格式。每个子图都显示了不同的数学函数,并且所有轴都使用了逗号作为小数分隔符。
8. 在3D图中应用逗号格式
Matplotlib也支持创建3D图表,我们同样可以在3D图中应用逗号格式。
import matplotlib.pyplot as plt
import numpy as np
from matplotlib.ticker import FuncFormatter
from mpl_toolkits.mplot3d import Axes3D

def comma_formatter(x, pos):
    return f"{x:.2f}".replace('.', ',')

fig = plt.figure(figsize=(10, 8))
ax = fig.add_subplot(111, projection='3d')

# 生成数据
x = np.linspace(-5, 5, 50)
y = np.linspace(-5, 5, 50)
X, Y = np.meshgrid(x, y)
Z = np.sin(np.sqrt(X**2 + Y**2))

# 绘制3D表面
surf = ax.plot_surface(X, Y, Z, cmap='viridis')

ax.set_title('3D Surface Plot with Comma Formatter - how2matplotlib.com')
ax.set_xlabel('X axis')
ax.set_ylabel('Y axis')
ax.set_zlabel('Z axis')

formatter = FuncFormatter(comma_formatter)
ax.xaxis.set_major_formatter(formatter)
ax.yaxis.set_major_formatter(formatter)
ax.zaxis.set_major_formatter(formatter)

fig.colorbar(surf)
plt.show()
Output:
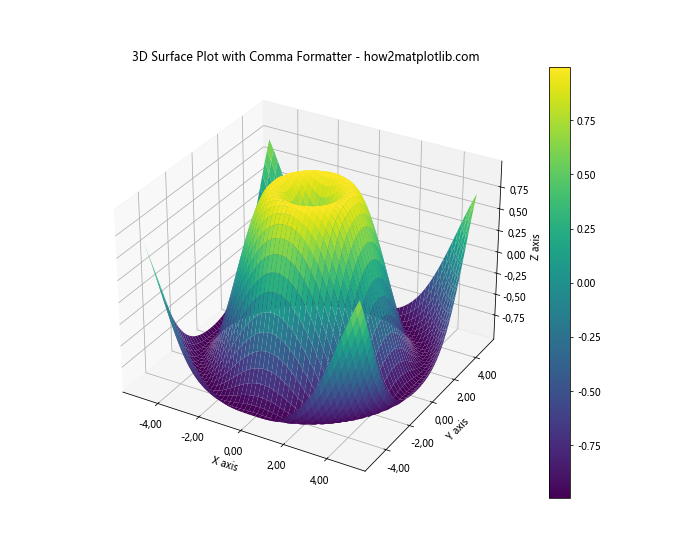
这个例子展示了如何在3D表面图中应用逗号格式。我们将逗号格式应用到了x轴、y轴和z轴。
9. 在极坐标图中使用逗号格式
极坐标图是另一种特殊的图表类型,我们也可以在其中应用逗号格式。
import matplotlib.pyplot as plt
import numpy as np
from matplotlib.ticker import FuncFormatter

def comma_formatter(x, pos):
    return f"{x:.2f}".replace('.', ',')

r = np.linspace(0, 2, 100)
theta = 2 * np.pi * r

fig, ax = plt.subplots(figsize=(10, 10), subplot_kw=dict(projection='polar'))
ax.plot(theta, r)

ax.set_title('Polar Plot with Comma Formatter - how2matplotlib.com')
ax.set_rticks([0.5, 1, 1.5, 2])

formatter = FuncFormatter(comma_formatter)
ax.yaxis.set_major_formatter(formatter)

plt.show()
Output:
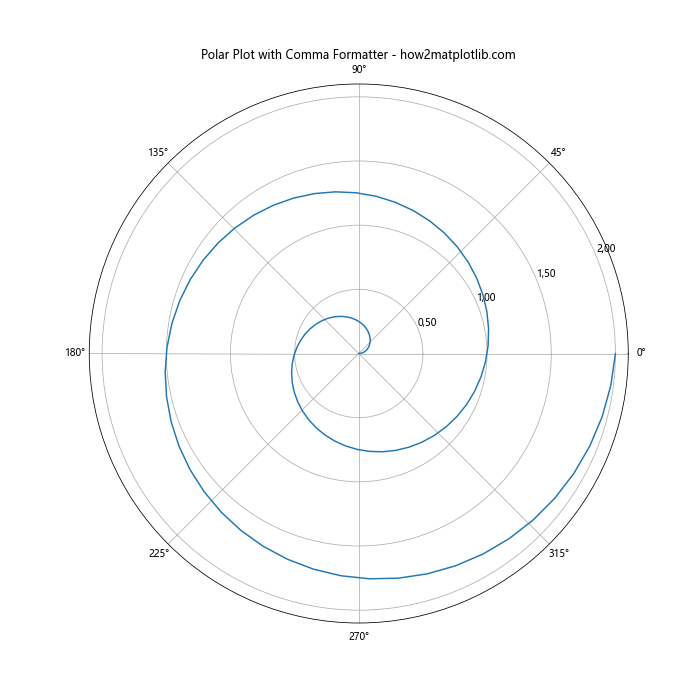
在这个极坐标图例子中,我们将逗号格式应用到了径向轴(r轴)上。
10. 在对数刻度图中应用逗号格式
对数刻度图在处理跨越多个数量级的数据时非常有用。我们也可以在对数刻度图中应用逗号格式。
import matplotlib.pyplot as plt
import numpy as np
from matplotlib.ticker import FuncFormatter

def comma_formatter(x, pos):
    return f"{x:.2f}".replace('.', ',')

x = np.logspace(0, 5, 100)
y = x**2

fig, ax = plt.subplots(figsize=(10, 6))
ax.loglog(x, y, label='y = x^2 - how2matplotlib.com')

ax.set_title('Log-Log Plot with Comma Formatter - how2matplotlib.com')
ax.set_xlabel('X axis (log scale)')
ax.set_ylabel('Y axis (log scale)')

formatter = FuncFormatter(comma_formatter)
ax.xaxis.set_major_formatter(formatter)
ax.yaxis.set_major_formatter(formatter)

plt.legend()
plt.grid(True)
plt.show()
Output:
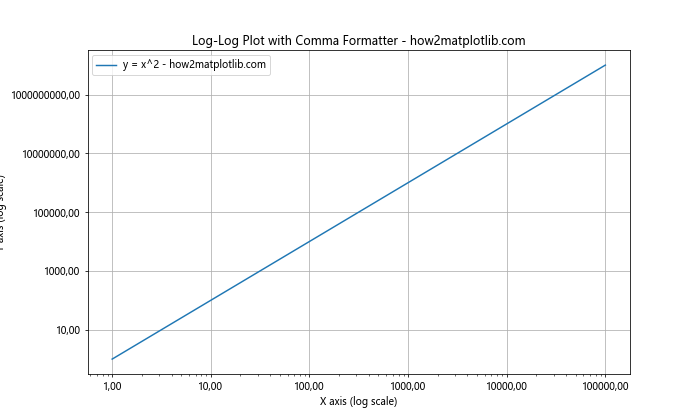
这个例子展示了如何在对数-对数图中应用逗号格式。尽管坐标轴使用了对数刻度,我们仍然可以使用逗号作为小数分隔符。
11. 在误差条图中使用逗号格式
误差条图在显示数据的不确定性时非常有用。我们可以在误差条图中应用逗号格式,使其更符合某些地区的数字表示习惯。
import matplotlib.pyplot as plt
import numpy as np
from matplotlib.ticker import FuncFormatter

def comma_formatter(x, pos):
    return f"{x:.2f}".replace('.', ',')

x = np.arange(1, 5)
y = np.random.rand(4) * 10
error = np.random.rand(4)

fig, ax = plt.subplots(figsize=(10, 6))
ax.errorbar(x, y, yerr=error, fmt='o', capsize=5, label='Data with Error - how2matplotlib.com')

ax.set_title('Error Bar Plot withComma Formatter - how2matplotlib.com')
ax.set_xlabel('X axis')
ax.set_ylabel('Y axis')

formatter = FuncFormatter(comma_formatter)
ax.yaxis.set_major_formatter(formatter)

plt.legend()
plt.grid(True)
plt.show()
Output:
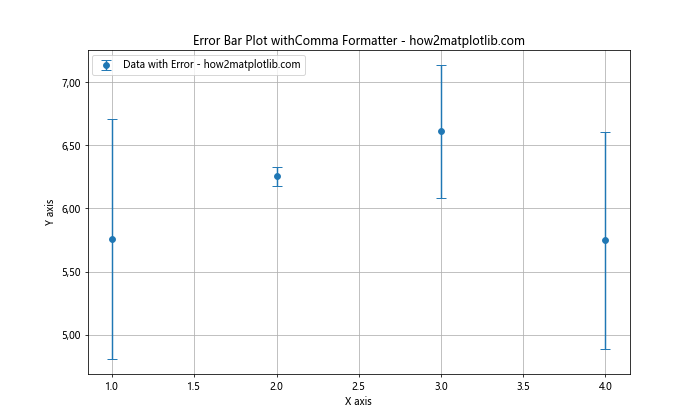
在这个误差条图例子中,我们将逗号格式应用到了y轴上。这样,数据点的值和误差范围都会以逗号作为小数分隔符显示。
12. 在箱线图中应用逗号格式
箱线图是一种用于显示数据分布的重要图表类型。我们可以在箱线图中应用逗号格式,使其更适合某些地区的用户。
import matplotlib.pyplot as plt
import numpy as np
from matplotlib.ticker import FuncFormatter

def comma_formatter(x, pos):
    return f"{x:.2f}".replace('.', ',')

np.random.seed(42)
data = [np.random.normal(0, std, 100) for std in range(1, 5)]

fig, ax = plt.subplots(figsize=(10, 6))
bp = ax.boxplot(data, labels=['A', 'B', 'C', 'D'])

ax.set_title('Box Plot with Comma Formatter - how2matplotlib.com')
ax.set_xlabel('Groups')
ax.set_ylabel('Values')

formatter = FuncFormatter(comma_formatter)
ax.yaxis.set_major_formatter(formatter)

plt.show()
Output:
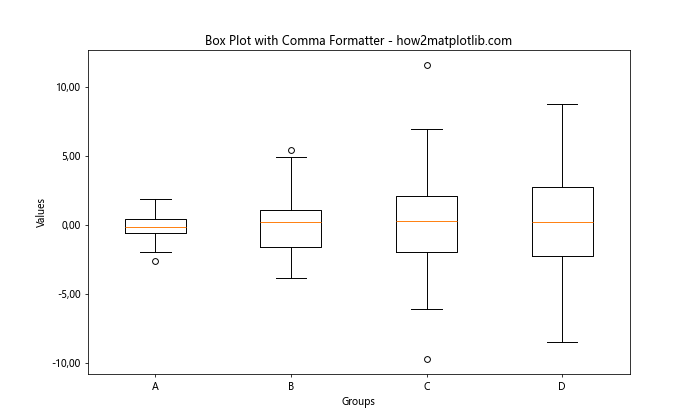
在这个箱线图例子中,我们将逗号格式应用到了y轴上。这样,箱线图中的所有数值(包括中位数、四分位数和异常值)都会以逗号作为小数分隔符显示。
13. 在热图中使用逗号格式
热图是一种用颜色来表示数值大小的图表类型。我们可以在热图的颜色条中应用逗号格式。
import matplotlib.pyplot as plt
import numpy as np
from matplotlib.ticker import FuncFormatter

def comma_formatter(x, pos):
    return f"{x:.2f}".replace('.', ',')

np.random.seed(42)
data = np.random.rand(10, 10)

fig, ax = plt.subplots(figsize=(10, 8))
im = ax.imshow(data, cmap='viridis')

ax.set_title('Heatmap with Comma Formatter - how2matplotlib.com')
ax.set_xlabel('X axis')
ax.set_ylabel('Y axis')

cbar = fig.colorbar(im)
cbar.ax.yaxis.set_major_formatter(FuncFormatter(comma_formatter))

plt.show()
Output:
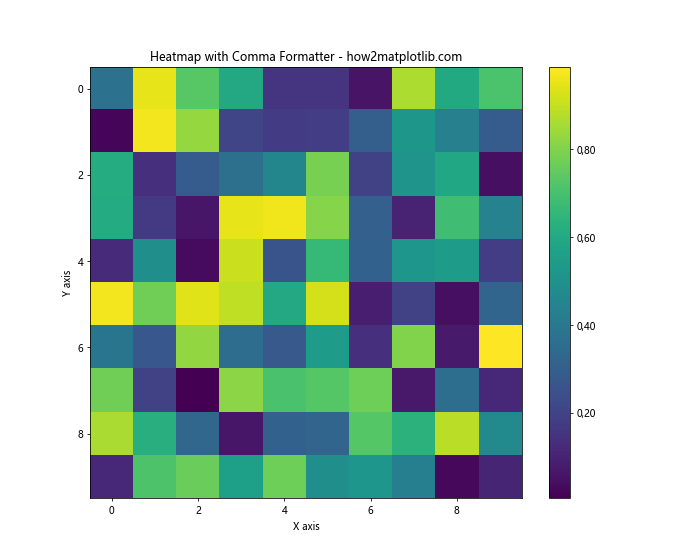
在这个热图例子中,我们将逗号格式应用到了颜色条的刻度上。这样,颜色条上的数值会以逗号作为小数分隔符显示。
14. 在饼图中应用逗号格式
虽然饼图通常不会在图表上直接显示数值,但我们可以在图例或数据标签中应用逗号格式。
import matplotlib.pyplot as plt
from matplotlib.ticker import FuncFormatter

def comma_formatter(x, pos):
    return f"{x:.2f}".replace('.', ',')

sizes = [15, 30, 45, 10]
labels = ['A', 'B', 'C', 'D']
explode = (0, 0.1, 0, 0)

fig, ax = plt.subplots(figsize=(10, 8))
patches, texts, autotexts = ax.pie(sizes, explode=explode, labels=labels, autopct=comma_formatter,
                                   shadow=True, startangle=90)

ax.set_title('Pie Chart with Comma Formatter - how2matplotlib.com')

plt.show()
在这个饼图例子中,我们将逗号格式应用到了饼图的百分比标签上。这是通过将我们的comma_formatter函数传递给pie函数的autopct参数实现的。
15. 在堆叠面积图中使用逗号格式
堆叠面积图是一种用于显示多个数据系列随时间变化的图表类型。我们可以在y轴上应用逗号格式。
import matplotlib.pyplot as plt
import numpy as np
from matplotlib.ticker import FuncFormatter

def comma_formatter(x, pos):
    return f"{x:.2f}".replace('.', ',')

x = np.arange(10)
y1 = np.random.rand(10) * 10
y2 = np.random.rand(10) * 10
y3 = np.random.rand(10) * 10

fig, ax = plt.subplots(figsize=(10, 6))
ax.stackplot(x, y1, y2, y3, labels=['A - how2matplotlib.com', 'B - how2matplotlib.com', 'C - how2matplotlib.com'])

ax.set_title('Stacked Area Plot with Comma Formatter - how2matplotlib.com')
ax.set_xlabel('X axis')
ax.set_ylabel('Y axis')

formatter = FuncFormatter(comma_formatter)
ax.yaxis.set_major_formatter(formatter)

plt.legend(loc='upper left')
plt.show()
Output:
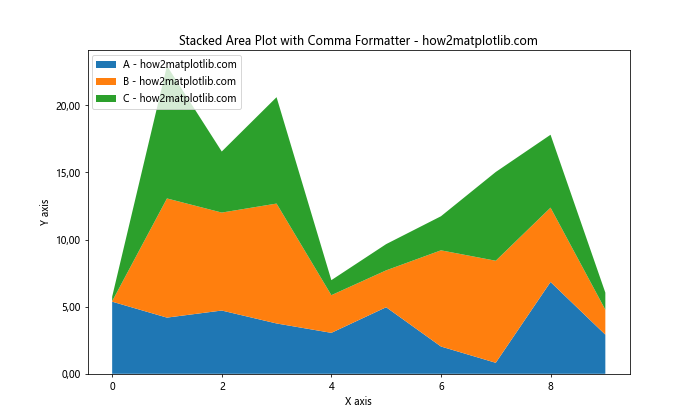
在这个堆叠面积图例子中,我们将逗号格式应用到了y轴上。这样,y轴上的所有数值都会以逗号作为小数分隔符显示。
16. 在极坐标条形图中应用逗号格式
极坐标条形图是一种特殊的图表类型,我们可以在径向轴上应用逗号格式。
import matplotlib.pyplot as plt
import numpy as np
from matplotlib.ticker import FuncFormatter

def comma_formatter(x, pos):
    return f"{x:.2f}".replace('.', ',')

N = 8
theta = np.linspace(0.0, 2 * np.pi, N, endpoint=False)
radii = 10 * np.random.rand(N)
width = np.pi / 4 * np.random.rand(N)

fig, ax = plt.subplots(figsize=(10, 10), subplot_kw=dict(projection='polar'))
bars = ax.bar(theta, radii, width=width, bottom=0.0)

ax.set_title('Polar Bar Plot with Comma Formatter - how2matplotlib.com')

formatter = FuncFormatter(comma_formatter)
ax.yaxis.set_major_formatter(formatter)

plt.show()
Output:
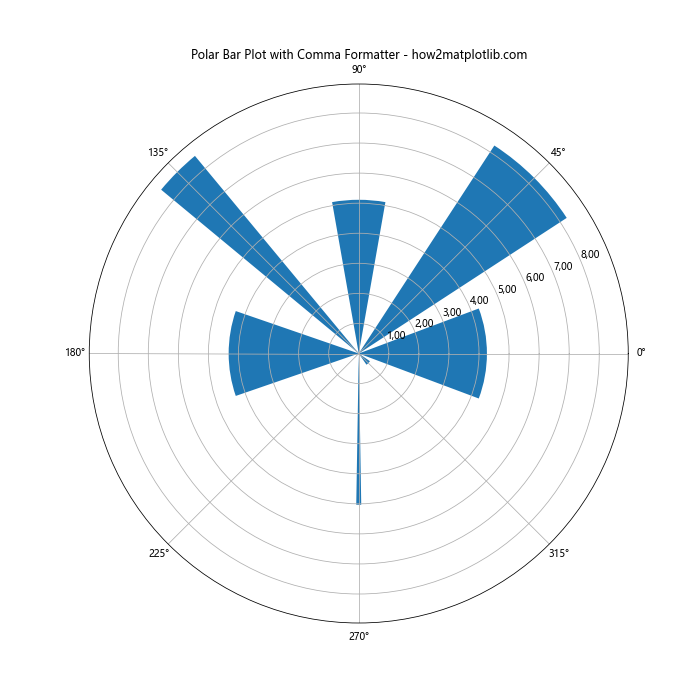
在这个极坐标条形图例子中,我们将逗号格式应用到了径向轴(r轴)上。这样,径向轴上的所有数值都会以逗号作为小数分隔符显示。
17. 在双轴图中使用逗号格式
双轴图允许我们在同一个图表中显示具有不同尺度的两组数据。我们可以在两个y轴上分别应用逗号格式。
import matplotlib.pyplot as plt
import numpy as np
from matplotlib.ticker import FuncFormatter

def comma_formatter(x, pos):
    return f"{x:.2f}".replace('.', ',')

x = np.linspace(0, 10, 100)
y1 = np.sin(x)
y2 = np.exp(x)

fig, ax1 = plt.subplots(figsize=(10, 6))

color = 'tab:red'
ax1.set_xlabel('X axis')
ax1.set_ylabel('Sin(x)', color=color)
ax1.plot(x, y1, color=color, label='Sin(x) - how2matplotlib.com')
ax1.tick_params(axis='y', labelcolor=color)

ax2 = ax1.twinx()  # 创建共享x轴的第二个y轴

color = 'tab:blue'
ax2.set_ylabel('Exp(x)', color=color)
ax2.plot(x, y2, color=color, label='Exp(x) - how2matplotlib.com')
ax2.tick_params(axis='y', labelcolor=color)

formatter = FuncFormatter(comma_formatter)
ax1.yaxis.set_major_formatter(formatter)
ax2.yaxis.set_major_formatter(formatter)

fig.tight_layout()
plt.title('Dual Axis Plot with Comma Formatter - how2matplotlib.com')
plt.show()
Output:
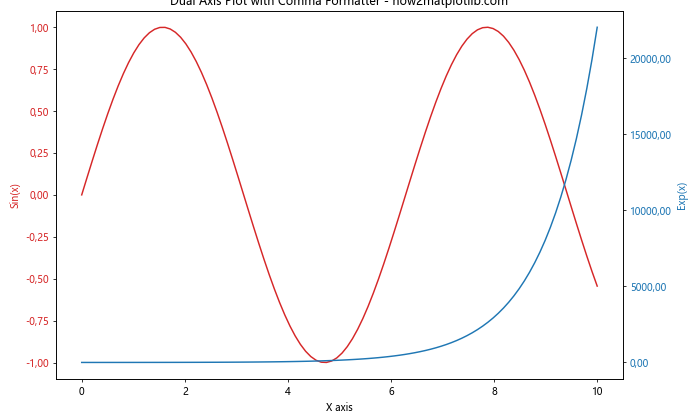
在这个双轴图例子中,我们将逗号格式应用到了两个y轴上。这样,两个y轴上的所有数值都会以逗号作为小数分隔符显示。
结论
通过以上详细的介绍和多个实例,我们可以看到在Matplotlib中将小数点更改为逗号是完全可行的,而且可以应用于各种不同类型的图表。这种技术可以让我们的图表更好地适应不同地区的数字表示习惯,提高数据可视化的可读性和适用性。
主要的方法包括:
- 使用locale设置全局数字格式
- 使用ScalarFormatter自定义数字格式
- 使用FuncFormatter进行更灵活的格式化
这些方法可以单独使用,也可以根据需要组合使用。选择哪种方法主要取决于你的具体需求和使用场景。
需要注意的是,更改数字格式可能会影响图表的整体布局,特别是当数字变长时。因此,在应用这些技术时,可能需要调整图表的其他方面,如图表大小、字体大小、标签位置等,以确保最终的图表既美观又易读。
最后,虽然本文主要讨论了将小数点更改为逗号的方法,但这些技术也可以用于其他类型的数字格式化,如添加千位分隔符、更改小数位数等。通过灵活运用这些技术,我们可以创建出更加国际化和个性化的数据可视化图表。
 极客教程
极客教程