How to Add Title to Subplots in Matplotlib
参考:How to Add Title to Subplots in Matplotlib
在使用Matplotlib进行数据可视化时,经常需要创建包含多个子图(subplots)的图表。为了使图表更加清晰易懂,为每个子图添加标题是一个常见的需求。本文将详细介绍如何在Matplotlib中给子图添加标题,并提供多个示例代码,帮助读者更好地掌握这一技能。
1. 基础知诀
在Matplotlib中,subplot是一个非常基础的功能,它允许我们在一个画布上创建多个图表。每个子图都可以有自己的坐标轴和标题。首先,我们需要了解如何创建一个基本的子图。
示例代码 1:创建一个简单的子图
import matplotlib.pyplot as plt

# 创建一个图和一个子图
fig, ax = plt.subplots()
ax.plot([1, 2, 3, 4, 5], [1, 4, 9, 16, 25])
ax.set_title("Simple Plot - how2matplotlib.com")
plt.show()
Output:
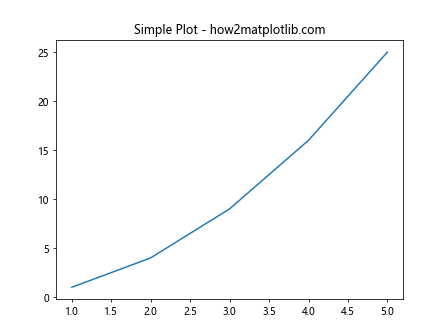
在上面的代码中,我们使用了plt.subplots()来创建一个图和一个子图。然后,我们使用ax.set_title()方法为子图设置了标题。
2. 多个子图的标题
当我们在一个画布上创建多个子图时,为每个子图设置一个清晰的标题变得尤为重要。
示例代码 2:创建两个子图并分别设置标题
import matplotlib.pyplot as plt

# 创建一个图和两个子图
fig, (ax1, ax2) = plt.subplots(1, 2)
ax1.plot([1, 2, 3, 4, 5], [1, 4, 9, 16, 25])
ax1.set_title("First Subplot - how2matplotlib.com")
ax2.plot([1, 2, 3, 4, 5], [25, 16, 9, 4, 1])
ax2.set_title("Second Subplot - how2matplotlib.com")
plt.show()
Output:
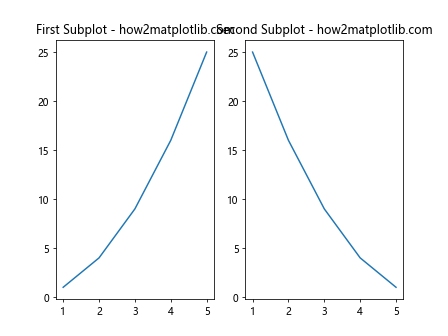
在这个示例中,我们创建了两个水平排列的子图,并分别为它们设置了标题。
3. 复杂布局的子图标题
对于更复杂的子图布局,我们可以使用GridSpec来精细控制子图的位置和大小。
示例代码 3:使用GridSpec创建复杂布局的子图
import matplotlib.pyplot as plt
from matplotlib.gridspec import GridSpec

fig = plt.figure()
gs = GridSpec(2, 2, figure=fig)

ax1 = fig.add_subplot(gs[0, 0])
ax2 = fig.add_subplot(gs[0, 1])
ax3 = fig.add_subplot(gs[1, :])

ax1.plot([1, 2, 3, 4, 5], [1, 4, 9, 16, 25])
ax1.set_title("Top Left - how2matplotlib.com")
ax2.plot([1, 2, 3, 4, 5], [25, 16, 9, 4, 1])
ax2.set_title("Top Right - how2matplotlib.com")
ax3.plot([1, 2, 3, 4, 5], [5, 10, 15, 20, 25])
ax3.set_title("Bottom Span - how2matplotlib.com")
plt.show()
Output:
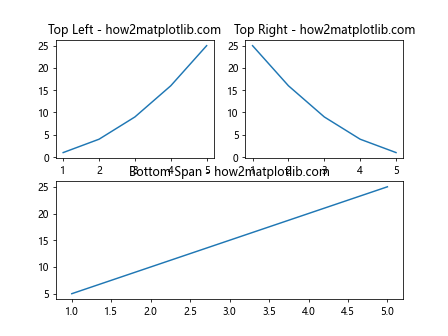
在这个示例中,我们使用GridSpec创建了一个2×2的网格,但第三个子图跨越了整个底部行。
4. 调整子图间距
当我们在一个画布上创建多个子图时,子图之间可能会相互干扰。我们可以调整子图间的间距,以确保标题和图表内容不会重叠。
示例代码 4:调整子图间距
import matplotlib.pyplot as plt

fig, axs = plt.subplots(2, 2)
axs[0, 0].plot([1, 2, 3, 4, 5], [1, 4, 9, 16, 25])
axs[0, 0].set_title("Top Left - how2matplotlib.com")
axs[0, 1].plot([1, 2, 3, 4, 5], [25, 16, 9, 4, 1])
axs[0, 1].set_title("Top Right - how2matplotlib.com")
axs[1, 0].plot([1, 2, 3, 4, 5], [5, 10, 15, 20, 25])
axs[1, 0].set_title("Bottom Left - how2matplotlib.com")
axs[1, 1].plot([1, 2, 3, 4, 5], [25, 20, 15, 10, 5])
axs[1, 1].set_title("Bottom Right - how2matplotlib.com")

# 调整子图间距
plt.subplots_adjust(hspace=0.5, wspace=0.5)
plt.show()
Output:
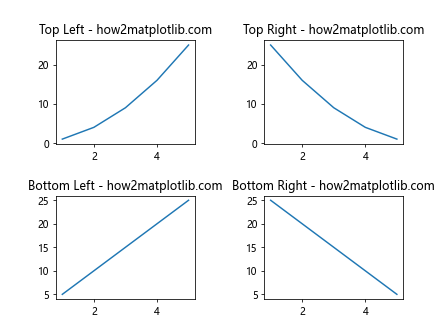
在这个示例中,我们使用了plt.subplots_adjust()函数来调整子图之间的水平和垂直间距。
5. 共享轴的子图标题
在某些情况下,我们可能希望多个子图共享相同的x轴或y轴。在这种情况下,我们仍然需要为每个子图设置清晰的标题。
示例代码 5:创建共享轴的子图并设置标题
import matplotlib.pyplot as plt

# 创建共享y轴的子图
fig, (ax1, ax2) = plt.subplots(1, 2, sharey=True)
ax1.plot([1, 2, 3, 4, 5], [1, 4, 9, 16, 25])
ax1.set_title("Shared Y-axis 1 - how2matplotlib.com")
ax2.plot([1, 2, 3, 4, 5], [25, 16, 9, 4, 1])
ax2.set_title("Shared Y-axis 2 - how2matplotlib.com")
plt.show()
Output:
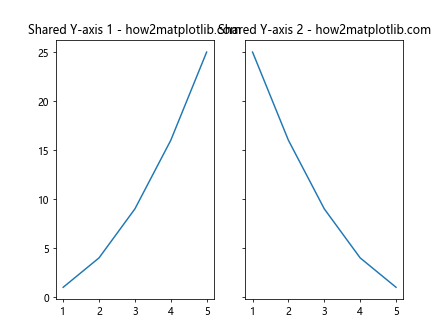
在这个示例中,我们创建了两个子图,它们共享相同的y轴。每个子图都有自己的标题,清楚地标识了它们的内容。
6. 使用tight_layout自动调整子图布局
当子图很多时,手动调整间距可能会非常繁琐。Matplotlib提供了tight_layout方法,可以自动调整子图的大小和位置,以确保内容不会重发。
示例代码 6:使用tight_layout自动调整子图
import matplotlib.pyplot as plt

fig, axs = plt.subplots(2, 2)
axs[0, 0].plot([1, 2, 3, 4, 5], [1, 4, 9, 16, 25])
axs[0, 0].set_title("Top Left - how2matplotlib.com")
axs[0, 1].plot([1, 2, 3, 4, 5], [25, 16, 9, 4, 1])
axs[0, 1].set_title("Top Right - how2matplotlib.com")
axs[1, 0].plot([1, 2, 3, 4, 5], [5, 10, 15, 20, 25])
axs[1, 0].set_title("Bottom Left - how2matplotlib.com")
axs[1, 1].plot([1, 2, 3, 4, 5], [25, 20, 15, 10, 5])
axs[1, 1].set_title("Bottom Right - how2matplotlib.com")

# 使用tight_layout自动调整子图布局
plt.tight_layout()
plt.show()
Output:
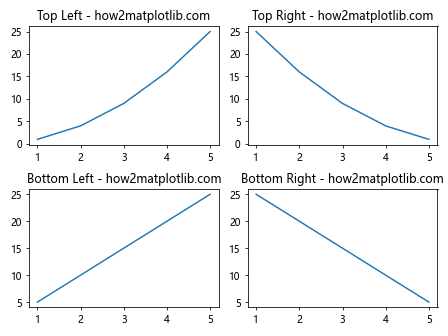
在上述代码中,我们使用了plt.tight_layout()来自动调整子图的布局,确保标题和轴标签不会重叠。
7. 添加整体标题和子标题
除了为每个子图单独设置标题外,有时我们还需要为整个图表设置一个总标题,以及为子图组添加共同的子标题。
示例代码 7:为图表添加总标题和子标题
import matplotlib.pyplot as plt

fig, axs = plt.subplots(2, 2)
fig.suptitle('Main Title: Visualization - how2matplotlib.com', fontsize=16)

axs[0, 0].plot([1, 2, 3, 4, 5], [1, 4, 9, 16, 25])
axs[0, 0].set_title("Subplot 1")
axs[0, 1].plot([1, 2, 3, 4, 5], [25, 16, 9, 4, 1])
axs[0, 1].set_title("Subplot 2")
axs[1, 0].plot([1, 2, 3, 4, 5], [5, 10, 15, 20, 25])
axs[1, 0].set_title("Subplot 3")
axs[1, 1].plot([1, 2, 3, 4, 5], [25, 20, 15, 10, 5])
axs[1, 1].set_title("Subplot 4")

plt.tight_layout(rect=[0, 0, 1, 0.95])  # Adjust the layout to make room for the main title
plt.show()
Output:
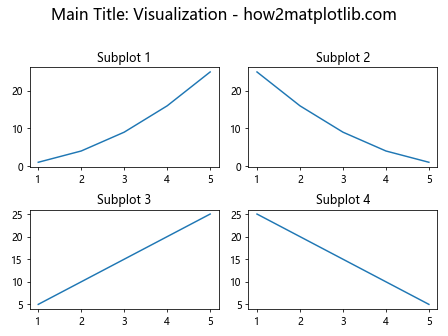
在这个示例中,我们使用fig.suptitle()为整个图表设置了一个总标题,并为每个子图设置了单独的标题。我们还调整了布局参数,以确保总标题有足够的空间显示,而不会与子图标题重叠。
8. 结论
在Matplotlib中为子图添加标题是一个重要的步骤,可以使图表更加清晰和专业。通过本文的介绍和示例代码,您应该能够掌握如何有效地为单个或多个子图设置标题,以及如何调整子图布局以避免标题重叠。使用这些技巧,您可以创建出既美观又信息丰富的数据可视化图表。
 极客教程
极客教程