如何使用Matplotlib让图表的xtick标签变成简单图画
参考: How can I make the xtick labels of a plot be simple drawings using Matplotlib
在数据可视化的过程中,有时候我们需要在x轴的刻度标签(xtick labels)上使用图画或者图标来代替传统的文本标签,以提供更直观的信息或者美化图表。Matplotlib是Python中一个非常强大的绘图库,它提供了丰富的接口来自定义图表的各个部分,包括xtick标签。本文将详细介绍如何使用Matplotlib将xtick标签替换为简单的图画。
示例代码1:使用自定义路径作为xtick标签
import matplotlib.pyplot as plt
from matplotlib.path import Path
import matplotlib.patches as patches

# 创建一个自定义的路径,这里以一个星星为例
def star_path():
    return Path(
        [
            (0, 1), (0.224514, 0.309017), (0.951057, 0.309017),
            (0.363271, -0.118033), (0.587785, -0.809017),
            (0, -0.381966), (-0.587785, -0.809017), (-0.363271, -0.118033),
            (-0.951057, 0.309017), (-0.224514, 0.309017), (0, 1)
        ],
        [
            Path.MOVETO, Path.LINETO, Path.LINETO, Path.LINETO,
            Path.LINETO, Path.LINETO, Path.LINETO, Path.LINETO,
            Path.LINETO, Path.LINETO, Path.CLOSEPOLY
        ]
    )

# 绘制一个简单的折线图
fig, ax = plt.subplots()
ax.plot([1, 2, 3, 4], [10, 20, 25, 30])

# 使用自定义的星星路径作为xtick标签
for label in range(1, 5):
    star = patches.PathPatch(star_path(), lw=2, color='blue', transform=ax.transData)
    star.set_transform(ax.get_xaxis_transform())
    ax.add_patch(star)
    star.set_clip_on(False)
    star.set_position((label, -0.05))

plt.show()
示例代码2:使用Matplotlib内置图标作为xtick标签
import matplotlib.pyplot as plt
from matplotlib.offsetbox import OffsetImage, AnnotationBbox

# 创建一个简单的折线图
fig, ax = plt.subplots()
ax.plot([1, 2, 3, 4], [10, 20, 25, 30])

# 使用Matplotlib内置的图标作为xtick标签
for label in range(1, 5):
    image = plt.imread('matplotlib.png')  # 假设这是一个内置的图标文件
    imbox = OffsetImage(image, zoom=0.1)
    ab = AnnotationBbox(imbox, (label, 0), xycoords='data', frameon=False, boxcoords="axes fraction", pad=0)
    ax.add_artist(ab)

plt.show()
示例代码3:使用Unicode字符作为xtick标签
import matplotlib.pyplot as plt

# 创建一个简单的折线图
fig, ax = plt.subplots()
ax.plot([1, 2, 3, 4], [10, 20, 25, 30])

# 使用Unicode字符作为xtick标签
unicode_chars = ['\u2600', '\u2601', '\u2602', '\u2603']  # 分别代表太阳、云、雨伞和雪人
ax.set_xticks([1, 2, 3, 4])
ax.set_xticklabels(unicode_chars)

plt.show()
示例代码4:使用Emoji表情作为xtick标签
import matplotlib.pyplot as plt
import numpy as np

# 创建一个简单的折线图
fig, ax = plt.subplots()
ax.plot([1, 2, 3, 4], [10, 20, 25, 30])

# 使用Emoji表情作为xtick标签
emojis = ['\U0001F600', '\U0001F602', '\U0001F604', '\U0001F606']  # 分别代表不同的笑脸表情
ax.set_xticks([1, 2, 3, 4])
ax.set_xticklabels(emojis)

plt.show()
示例代码5:使用TextPath自定义文本路径作为xtick标签
import matplotlib.pyplot as plt
from matplotlib.textpath import TextPath
from matplotlib.patches import PathPatch

# 创建一个简单的折线图
fig, ax = plt.subplots()
ax.plot([1, 2, 3, 4], [10, 20, 25, 30])

# 使用TextPath自定义文本路径作为xtick标签
for label in range(1, 5):
    text_path = TextPath((0, 0), f"how2matplotlib.com {label}", size=0.2)
    patch = PathPatch(text_path, lw=2, color='red', transform=ax.transData)
    patch.set_transform(ax.get_xaxis_transform())
    ax.add_patch(patch)
    patch.set_clip_on(False)
    patch.set_position((label, -0.05))

plt.show()
示例代码6:使用SVG文件作为xtick标签
import matplotlib.pyplot as plt
from matplotlib.offsetbox import OffsetImage, AnnotationBbox
import matplotlib.image as mpimg

# 创建一个简单的折线图
fig, ax = plt.subplots()
ax.plot([1, 2, 3, 4], [10, 20, 25, 30])

# 使用SVG文件作为xtick标签
for label in range(1, 5):
    image = mpimg.imread('example.svg')  # 假设这是一个SVG文件
    imbox = OffsetImage(image, zoom=0.1)
    ab = AnnotationBbox(imbox, (label, 0), xycoords='data', frameon=False, boxcoords="axes fraction", pad=0)
    ax.add_artist(ab)

plt.show()
示例代码7:使用自定义函数绘制xtick标签
import matplotlib.pyplot as plt
from matplotlib.text import Text

# 创建一个简单的折线图
fig, ax = plt.subplots()
ax.plot([1, 2, 3, 4], [10, 20, 25, 30])

# 使用自定义函数绘制xtick标签
def draw_custom_label(x, y, text):
    text_artist = Text(x, y, text, ha='center', va='center', fontsize=12)
    ax.add_artist(text_artist)

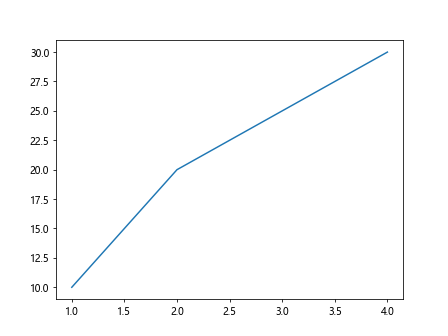
for label in range(1, 5):
    draw_custom_label(label, -0.05, f"how2matplotlib.com {label}")

plt.show()
Output:
示例代码8:使用图形和文本结合作为xtick标签
import matplotlib.pyplot as plt
from matplotlib.patches import Ellipse

# 创建一个简单的折线图
fig, ax = plt.subplots()
ax.plot([1, 2, 3, 4], [10, 20, 25, 30])

# 使用图形和文本结合作为xtick标签
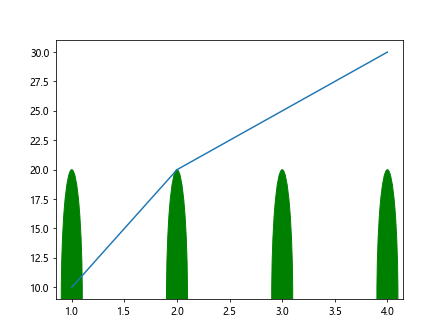
for label in range(1, 5):
    ellipse = Ellipse((label, 0), width=0.2, height=1, color='green', transform=ax.transData)
    ellipse.set_transform(ax.get_xaxis_transform())
    ax.add_patch(ellipse)
    ax.text(label, -0.1, f"how2matplotlib.com {label}", ha='center', va='top', fontsize=8)

plt.show()
Output:
示例代码9:使用自定义图标和颜色作为xtick标签
import matplotlib.pyplot as plt
from matplotlib.patches import RegularPolygon
import numpy as np

# 创建一个简单的折线图
fig, ax = plt.subplots()
ax.plot([1, 2, 3, 4], [10, 20, 25, 30])

# 使用自定义图标和颜色作为xtick标签
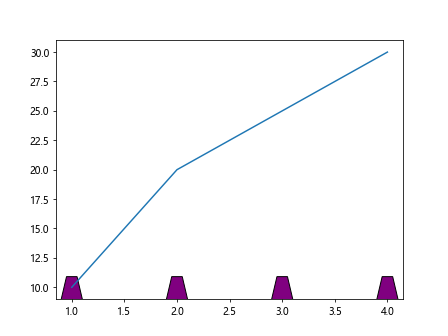
for label in range(1, 5):
    hexagon = RegularPolygon((label, 0), numVertices=6, radius=0.1, orientation=np.pi/6,
                             facecolor='purple', edgecolor='black', transform=ax.transData)
    hexagon.set_transform(ax.get_xaxis_transform())
    ax.add_patch(hexagon)
    ax.text(label, -0.1, f"how2matplotlib.com {label}", ha='center', va='top', fontsize=8)

plt.show()
Output:
示例代码10:使用自定义图形和动态位置调整作为xtick标签
import matplotlib.pyplot as plt
from matplotlib.patches import Circle

# 创建一个简单的折线图
fig, ax = plt.subplots()
ax.plot([1, 2, 3, 4], [10, 20, 25, 30])

# 使用自定义图形和动态位置调整作为xtick标签
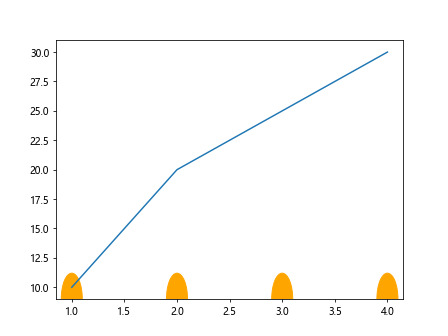
for label in range(1, 5):
    circle = Circle((label, 0), radius=0.1, color='orange', transform=ax.transData)
    circle.set_transform(ax.get_xaxis_transform())
    ax.add_patch(circle)
    ax.text(label, -0.15, f"how2matplotlib.com {label}", ha='center', va='top', fontsize=8)

plt.show()
Output:
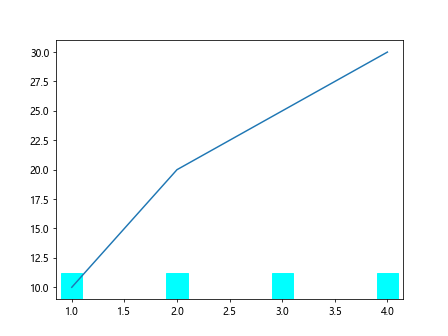
示例代码11:使用图案填充作为xtick标签
import matplotlib.pyplot as plt
from matplotlib.patches import Rectangle

# 创建一个简单的折线图
fig, ax = plt.subplots()
ax.plot([1, 2, 3, 4], [10, 20, 25, 30])

# 使用图案填充作为xtick标签
for label in range(1, 5):
    rect = Rectangle((label-0.1, -0.1), 0.2, 0.2, fill=True, color='cyan', hatch='/', transform=ax.transData)
    rect.set_transform(ax.get_xaxis_transform())
    ax.add_patch(rect)
    ax.text(label, -0.3, f"how2matplotlib.com {label}", ha='center', va='top', fontsize=8)

plt.show()
Output:
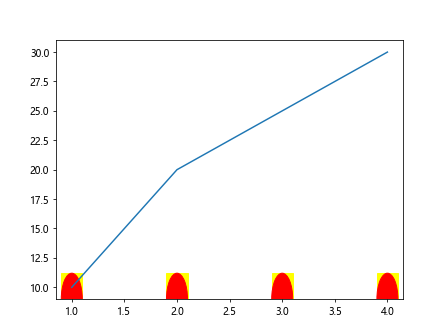
示例代码12:使用图形叠加作为xtick标签
import matplotlib.pyplot as plt
from matplotlib.patches import Rectangle, Circle

# 创建一个简单的折线图
fig, ax = plt.subplots()
ax.plot([1, 2, 3, 4], [10, 20, 25, 30])

# 使用图形叠加作为xtick标签
for label in range(1, 5):
    rect = Rectangle((label-0.1, -0.1), 0.2, 0.2, fill=True, color='yellow', transform=ax.transData)
    circle = Circle((label, 0), radius=0.1, color='red', transform=ax.transData)
    rect.set_transform(ax.get_xaxis_transform())
    circle.set_transform(ax.get_xaxis_transform())
    ax.add_patch(rect)
    ax.add_patch(circle)
    ax.text(label, -0.3, f"how2matplotlib.com {label}", ha='center', va='top', fontsize=8)

plt.show()
Output:
以上示例展示了如何使用Matplotlib在xtick标签位置绘制各种图形和文本,从简单的Unicode字符到复杂的自定义路径和图形。通过这些方法,你可以根据需要自由地定制你的图表的x轴标签,使其更加符合你的可视化需求。
 极客教程
极客教程