如何使用Matplotlib绘制简单的3D线条
参考: How can I make a simple 3D line with Matplotlib
Matplotlib是一个非常强大的Python绘图库,它支持2D及3D图形的绘制。在本文中,我们将详细介绍如何使用Matplotlib来绘制简单的3D线条。我们将从基础知识开始,逐步深入到更复杂的示例中。
1. Matplotlib基础
在开始绘制3D线条之前,我们需要先了解一些Matplotlib的基础。Matplotlib是基于Python的绘图库,它可以用来绘制高质量的2D和3D图形。为了使用Matplotlib绘制3D图形,我们需要从mpl_toolkits.mplot3d模块中导入Axes3D类。
示例代码1:导入必要的库
import matplotlib.pyplot as plt
from mpl_toolkits.mplot3d import Axes3D
2. 创建3D坐标轴
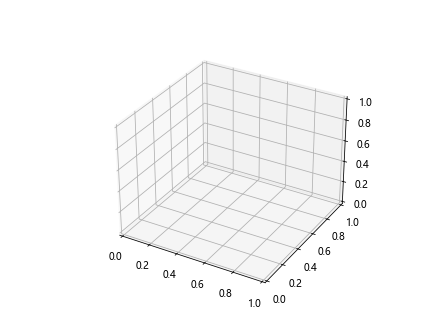
在Matplotlib中绘制3D图形的第一步是创建一个3D坐标轴。我们可以通过在plt.figure()方法中添加projection='3d'参数来创建一个3D坐标轴。
示例代码2:创建3D坐标轴
import matplotlib.pyplot as plt
from mpl_toolkits.mplot3d import Axes3D

fig = plt.figure()
ax = fig.add_subplot(111, projection='3d')
plt.show()
Output:
3. 绘制简单的3D线条
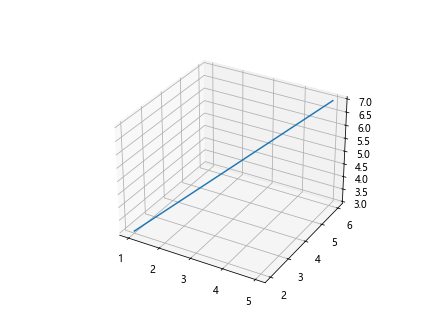
有了3D坐标轴之后,我们就可以在上面绘制3D线条了。绘制3D线条可以使用ax.plot()方法,需要提供x, y, z三个坐标的列表。
示例代码3:绘制一条简单的3D线条
import matplotlib.pyplot as plt
from mpl_toolkits.mplot3d import Axes3D

fig = plt.figure()
ax = fig.add_subplot(111, projection='3d')
x = [1, 2, 3, 4, 5]
y = [2, 3, 4, 5, 6]
z = [3, 4, 5, 6, 7]
ax.plot(x, y, z)
plt.show()
Output:
4. 自定义线条样式
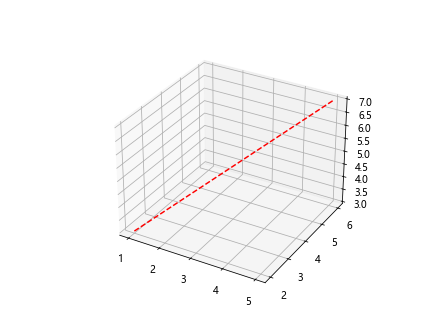
在绘制3D线条时,我们可以自定义线条的颜色、线型等样式。通过向ax.plot()方法添加更多的参数,我们可以轻松地改变线条的样式。
示例代码4:自定义线条颜色和线型
import matplotlib.pyplot as plt
from mpl_toolkits.mplot3d import Axes3D

fig = plt.figure()
ax = fig.add_subplot(111, projection='3d')
x = [1, 2, 3, 4, 5]
y = [2, 3, 4, 5, 6]
z = [3, 4, 5, 6, 7]
ax.plot(x, y, z, color='red', linestyle='dashed')
plt.show()
Output:
5. 添加标签和标题
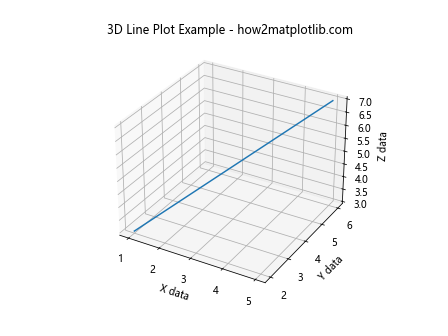
为了使图形更加清晰易懂,我们可以添加坐标轴标签和图形标题。使用ax.set_xlabel(), ax.set_ylabel(), ax.set_zlabel()和ax.set_title()方法可以添加这些元素。
示例代码5:添加坐标轴标签和标题
import matplotlib.pyplot as plt
from mpl_toolkits.mplot3d import Axes3D

fig = plt.figure()
ax = fig.add_subplot(111, projection='3d')
x = [1, 2, 3, 4, 5]
y = [2, 3, 4, 5, 6]
z = [3, 4, 5, 6, 7]
ax.plot(x, y, z)
ax.set_xlabel('X data')
ax.set_ylabel('Y data')
ax.set_zlabel('Z data')
ax.set_title('3D Line Plot Example - how2matplotlib.com')
plt.show()
Output:
6. 调整视角
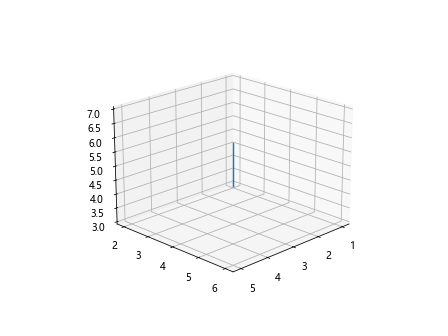
在3D图形中,调整视角是一个非常重要的功能,它可以帮助我们更好地理解数据的3D结构。使用ax.view_init()方法可以设置图形的俯视角度和方位角。
示例代码6:调整视角
import matplotlib.pyplot as plt
from mpl_toolkits.mplot3d import Axes3D

fig = plt.figure()
ax = fig.add_subplot(111, projection='3d')
x = [1, 2, 3, 4, 5]
y = [2, 3, 4, 5, 6]
z = [3, 4, 5, 6, 7]
ax.plot(x, y, z)
ax.view_init(elev=20, azim=45)
plt.show()
Output:
7. 绘制多条3D线条
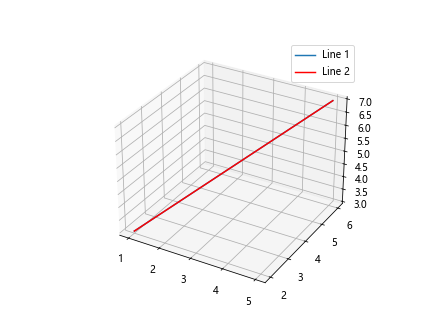
在同一个坐标轴上绘制多条3D线条可以帮助我们比较不同数据集之间的关系。只需要多次调用ax.plot()方法即可。
示例代码7:绘制多条3D线条
import matplotlib.pyplot as plt
from mpl_toolkits.mplot3d import Axes3D

fig = plt.figure()
ax = fig.add_subplot(111, projection='3d')
x1 = [1, 2, 3, 4, 5]
y1 = [2, 3, 4, 5, 6]
z1 = [3, 4, 5, 6, 7]
x2 = [5, 4, 3, 2, 1]
y2 = [6, 5, 4, 3, 2]
z2 = [7, 6, 5, 4, 3]
ax.plot(x1, y1, z1, label='Line 1')
ax.plot(x2, y2, z2, label='Line 2', color='red')
ax.legend()
plt.show()
Output:
8. 使用不同的标记
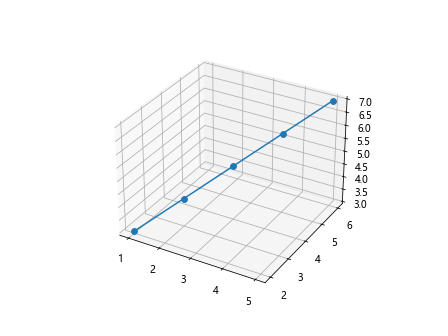
在3D线条中使用不同的标记可以帮助我们区分图中的不同点。通过marker参数可以设置标记的样式。
示例代码8:使用不同的标记
import matplotlib.pyplot as plt
from mpl_toolkits.mplot3d import Axes3D

fig = plt.figure()
ax = fig.add_subplot(111, projection='3d')
x = [1, 2, 3, 4, 5]
y = [2, 3, 4, 5, 6]
z = [3, 4, 5, 6, 7]
ax.plot(x, y, z, marker='o')
plt.show()
Output:
9. 结合使用线条和散点
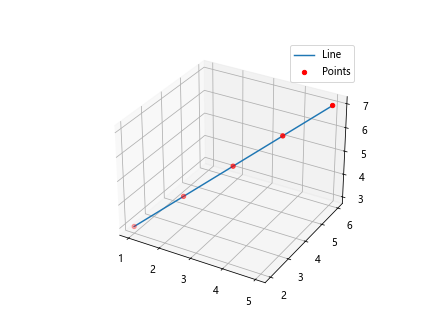
在一些情况下,我们可能需要在3D线条图中同时显示线条和散点。这可以通过分别使用ax.plot()和ax.scatter()方法来实现。
示例代码9:结合使用线条和散点
import matplotlib.pyplot as plt
from mpl_toolkits.mplot3d import Axes3D

fig = plt.figure()
ax = fig.add_subplot(111, projection='3d')
x = [1, 2, 3, 4, 5]
y = [2, 3, 4, 5, 6]
z = [3, 4, 5, 6, 7]
ax.plot(x, y, z, label='Line')
ax.scatter(x, y, z, color='red', label='Points')
ax.legend()
plt.show()
Output:
10. 自定义图例
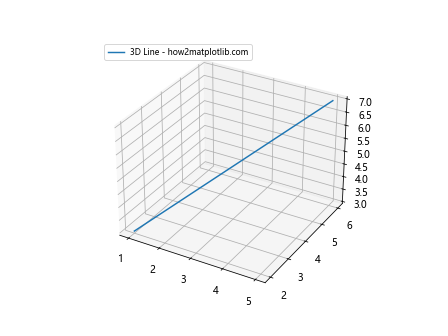
在绘制包含多条线条或多种标记的图形时,添加图例是非常有用的。通过ax.legend()方法可以添加图例,并通过传递参数来自定义图例的位置和外观。
示例代码10:自定义图例
import matplotlib.pyplot as plt
from mpl_toolkits.mplot3d import Axes3D

fig = plt.figure()
ax = fig.add_subplot(111, projection='3d')
x = [1, 2, 3, 4, 5]
y = [2, 3, 4, 5, 6]
z = [3, 4, 5, 6, 7]
ax.plot(x, y, z, label='3D Line - how2matplotlib.com')
ax.legend(loc='upper left', fontsize='small')
plt.show()
Output:
11. 设置坐标轴范围
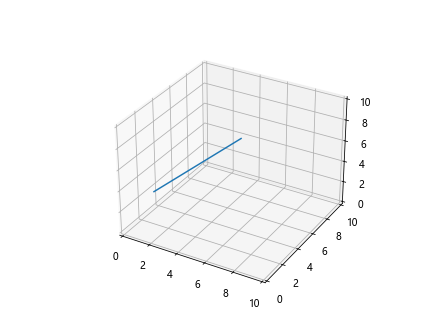
有时候我们需要设置坐标轴的范围,以便更好地展示数据。可以使用ax.set_xlim(), ax.set_ylim(), ax.set_zlim()方法来设置x, y, z轴的范围。
示例代码11:设置坐标轴范围
import matplotlib.pyplot as plt
from mpl_toolkits.mplot3d import Axes3D

fig = plt.figure()
ax = fig.add_subplot(111, projection='3d')
x = [1, 2, 3, 4, 5]
y = [2, 3, 4, 5, 6]
z = [3, 4, 5, 6, 7]
ax.plot(x, y, z)
ax.set_xlim(0, 10)
ax.set_ylim(0, 10)
ax.set_zlim(0, 10)
plt.show()
Output:
12. 添加网格线
在3D图形中添加网格线可以帮助我们更清晰地看到数据点的位置。可以使用ax.grid()方法来添加网格线。
示例代码12:添加网格线
import matplotlib.pyplot as plt
from mpl_toolkits.mplot3d import Axes3D

fig = plt.figure()
ax = fig.add_subplot(111, projection='3d')
x = [1, 2, 3, 4, 5]
y = [2, 3, 4, 5, 6]
z = [3, 4, 5, 6, 7]
ax.plot(x, y, z)
ax.grid(True)
plt.show()
Output:
13. 使用不同的线宽
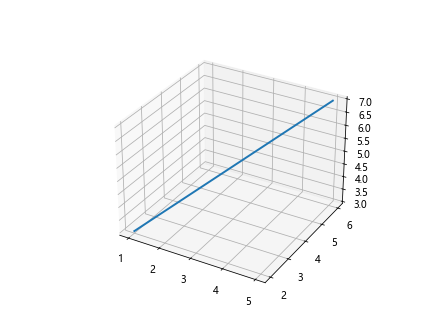
我们可以通过设置线宽来强调某些线条。使用linewidth或lw参数可以改变线条的宽度。
示例代码13:使用不同的线宽
import matplotlib.pyplot as plt
from mpl_toolkits.mplot3d import Axes3D

fig = plt.figure()
ax = fig.add_subplot(111, projection='3d')
x = [1, 2, 3, 4, 5]
y = [2, 3, 4, 5, 6]
z = [3, 4, 5, 6, 7]
ax.plot(x, y, z, linewidth=2)
plt.show()
Output:
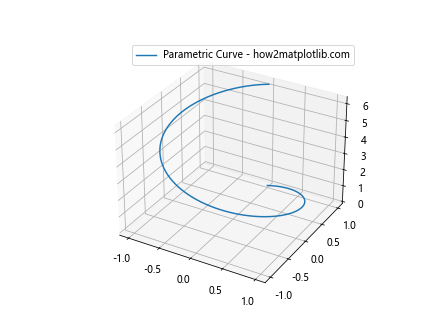
14. 绘制参数化的3D线条
有时候我们需要根据数学公式来绘制3D线条。例如,我们可以绘制一个螺旋线。
示例代码14:绘制参数化的3D线条
import numpy as np
import matplotlib.pyplot as plt
from mpl_toolkits.mplot3d import Axes3D

fig = plt.figure()
ax = fig.add_subplot(111, projection='3d')
t = np.linspace(0, 2*np.pi, 100)
x = np.sin(t)
y = np.cos(t)
z = t
ax.plot(x, y, z, label='Parametric Curve - how2matplotlib.com')
ax.legend()
plt.show()
Output:
15. 使用透明度
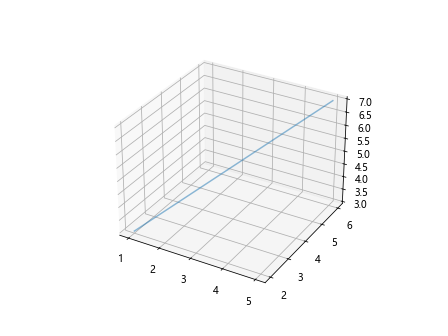
设置线条的透明度可以让我们的图形看起来更加立体。通过alpha参数可以设置线条的透明度。
示例代码15:使用透明度
import numpy as np
import matplotlib.pyplot as plt
from mpl_toolkits.mplot3d import Axes3D

fig = plt.figure()
ax = fig.add_subplot(111, projection='3d')
x = [1, 2, 3, 4, 5]
y = [2, 3, 4, 5, 6]
z = [3, 4, 5, 6, 7]
ax.plot(x, y, z, alpha=0.5)
plt.show()
Output:
16. 绘制复杂的3D图形
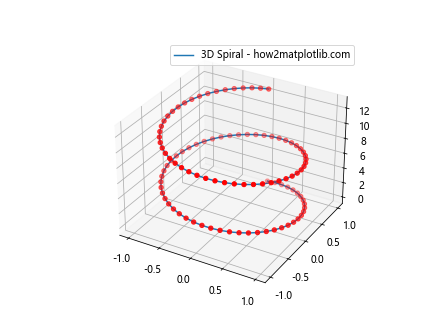
我们可以结合前面学到的知识来绘制更复杂的3D图形。例如,我们可以绘制一个3D螺旋线,并在每个点上添加散点。
示例代码16:绘制复杂的3D图形
import numpy as np
import matplotlib.pyplot as plt
from mpl_toolkits.mplot3d import Axes3D

fig = plt.figure()
ax = fig.add_subplot(111, projection='3d')
t = np.linspace(0, 4*np.pi, 100)
x = np.sin(t)
y = np.cos(t)
z = t
ax.plot(x, y, z, label='3D Spiral - how2matplotlib.com')
ax.scatter(x, y, z, color='red')
ax.legend()
plt.show()
Output:
17. 保存图形到文件
我们可以将绘制好的图形保存到文件中。使用plt.savefig()方法可以将图形保存为多种格式,如PNG, PDF, SVG等。
示例代码17:保存图形到文件
import numpy as np
import matplotlib.pyplot as plt
from mpl_toolkits.mplot3d import Axes3D

fig = plt.figure()
ax = fig.add_subplot(111, projection='3d')
x = [1, 2, 3, 4, 5]
y = [2, 3, 4, 5, 6]
z = [3, 4, 5, 6, 7]
ax.plot(x, y, z)
plt.savefig('3d_line_plot_how2matplotlib.com.png')
18. 使用样式表
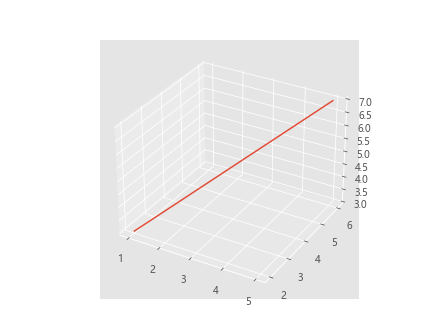
Matplotlib允许我们使用样式表来改变图形的整体外观。通过plt.style.use()方法可以应用不同的样式表。
示例代码18:使用样式表
import numpy as np
import matplotlib.pyplot as plt
from mpl_toolkits.mplot3d import Axes3D

plt.style.use('ggplot')
fig = plt.figure()
ax = fig.add_subplot(111, projection='3d')
x = [1, 2, 3, 4, 5]
y = [2, 3, 4, 5, 6]
z = [3, 4, 5, 6, 7]
ax.plot(x, y, z)
plt.show()
Output:
19. 结合使用多个坐标轴
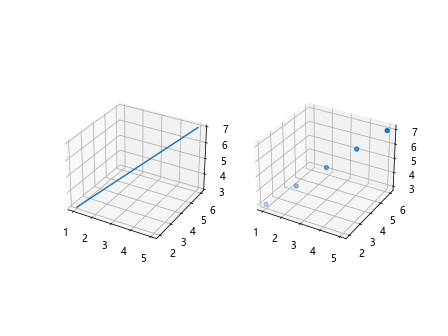
有时候我们需要在一个图形中显示多个坐标轴。可以使用fig.add_subplot()方法来创建多个坐标轴。
示例代码19:结合使用多个坐标轴
import numpy as np
import matplotlib.pyplot as plt
from mpl_toolkits.mplot3d import Axes3D

fig = plt.figure()
ax1 = fig.add_subplot(121, projection='3d')
ax2 = fig.add_subplot(122, projection='3d')
x = [1, 2, 3, 4, 5]
y = [2, 3, 4, 5, 6]
z = [3, 4, 5, 6, 7]
ax1.plot(x, y, z)
ax2.scatter(x, y, z)
plt.show()
Output:
20. 动态更新3D图形
在某些情况下,我们可能需要动态更新3D图形。可以使用FuncAnimation类来创建动画。
示例代码20:动态更新3D图形
from matplotlib.animation import FuncAnimation
import numpy as np
import matplotlib.pyplot as plt
from mpl_toolkits.mplot3d import Axes3D

fig = plt.figure()
ax = fig.add_subplot(111, projection='3d')

x = [1, 2, 3, 4, 5]
y = [2, 3, 4, 5, 6]
z = [3, 4, 5, 6, 7]
line, = ax.plot(x, y, z)

def update(frame):
    line.set_data(x[:frame], y[:frame])
    line.set_3d_properties(z[:frame])
    return line,

ani = FuncAnimation(fig, update, frames=range(1, len(x)+1), blit=True)
plt.show()
Output:
 极客教程
极客教程