diverging colormaps matplotlib
参考:diverging colormaps matplotlib
在数据可视化中,颜色选择是十分重要的因素之一。正确选择颜色可以帮助我们更好地理解数据,而 diverging colormaps 是一种在数据可视化中常用的配色方案。在 matplotlib 中,我们可以使用 diverging colormaps 来展示数据的分布和变化。
1. 创建 diverging colormap
首先,我们需要创建一个 diverging colormap。matplotlib 已经内置了一些常用的 diverging colormaps,比如 ‘RdBu’、’RdYlBu’ 等。我们可以通过 plt.get_cmap() 函数来获取这些 colormap。
import matplotlib.pyplot as plt

cmap = plt.get_cmap('RdBu')
2. 使用 diverging colormap
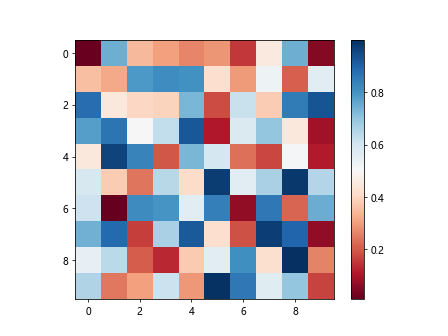
接下来,我们可以使用创建好的 diverging colormap 来绘制图表。例如,下面的代码展示了如何使用 ‘RdBu’ colormap 来绘制一个简单的热力图。
import numpy as np
import matplotlib.pyplot as plt

cmap = plt.get_cmap('RdBu')

data = np.random.rand(10, 10)
plt.imshow(data, cmap=cmap)
plt.colorbar()
plt.show()
Output:

3. 调整 colormap 的范围
有时候,我们需要调整 colormap 的范围来更好地展示数据的特点。我们可以使用 plt.Normalize() 函数来实现这一功能。
from matplotlib.colors import Normalize
import matplotlib.pyplot as plt

cmap = plt.get_cmap('RdBu')

norm = Normalize(vmin=0, vmax=1)
plt.imshow(data, cmap=cmap, norm=norm)
4. 自定义 diverging colormap
除了使用内置的 diverging colormap,我们还可以自定义一个 colormap。这样可以更好地控制颜色的分布和范围。下面的代码展示了如何创建一个自定义的 diverging colormap。
from matplotlib.colors import LinearSegmentedColormap
import matplotlib.pyplot as plt

cmap = plt.get_cmap('RdBu')

colors = [(0, 'blue'), (0.5, 'white'), (1, 'red')]
cmap_custom = LinearSegmentedColormap.from_list('custom_diverging', colors)
5. 使用自定义 diverging colormap
接下来,我们可以使用自定义的 diverging colormap 来绘制图表。例如,下面的代码展示了如何使用自定义的 colormap 来绘制一个柱状图。
x = np.arange(10)
y = np.random.rand(10)
plt.bar(x, y, color=cmap_custom(y))
6. 调整自定义 colormap 的范围
类似于内置的 colormap,我们也可以调整自定义 colormap 的范围。下面的代码展示了如何调整自定义 colormap 的范围。
norm_custom = Normalize(vmin=0, vmax=1)
plt.bar(x, y, color=cmap_custom(norm_custom(y)))
7. 使用 seaborn 中的 diverging colormap
除了 matplotlib,seaborn 也提供了一些优秀的 diverging colormap,如 ‘vlag’、’coolwarm’ 等。我们可以使用 seaborn 库来使用这些 colormap。
import seaborn as sns

sns.heatmap(data, cmap='vlag')
8. 选择适合的 diverging colormap
在选择 diverging colormap 时,需要考虑数据的特点和展示的目的。例如,如果数据中存在明显的正负差异,那么可以选择对比强烈的 colormap,如 ‘RdBu’;如果数据的变化范围比较平均,可以选择对比较柔和的 colormap,如 ‘coolwarm’。
9. 结论
通过本文的介绍,我们了解了如何在 matplotlib 中使用 diverging colormap 来展示数据,包括创建内置的 colormap、自定义colormap、调整colormap的范围等。选择合适的colormap可以帮助我们更好地理解数据,提升数据可视化的效果。
 极客教程
极客教程