Matplotlib 使用ax.annotate添加注释
参考:ax.annotate
在数据可视化中,添加注释是一种常见的方式,可以帮助观众更好地理解图表中的信息。在Matplotlib库中,我们可以使用ax.annotate方法来添加注释。
1. 在图中添加文本注释
首先我们来看一个简单的例子,如何在图中添加一个简单的文本注释。下面的代码将在图中坐标(0.5, 0.5)的位置添加一个文本注释。
import matplotlib.pyplot as plt

fig, ax = plt.subplots()
ax.annotate('This is an annotation', (0.5, 0.5))

plt.show()
Output:
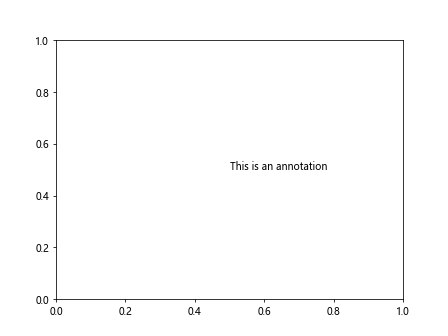
运行上面的代码,可以看到在图中心出现了一个文本注释”This is an annotation”。
2. 在图中添加箭头注释
除了文本注释,我们还可以在图中添加一个带有箭头的注释。下面的代码示例演示了如何在图中的两个坐标点之间添加一个带有箭头的注释。
import matplotlib.pyplot as plt

fig, ax = plt.subplots()
ax.annotate('This is arrow annotation', (0.2, 0.2), (0.5, 0.5),
            arrowprops=dict(facecolor='red', shrink=0.05))

plt.show()
Output:
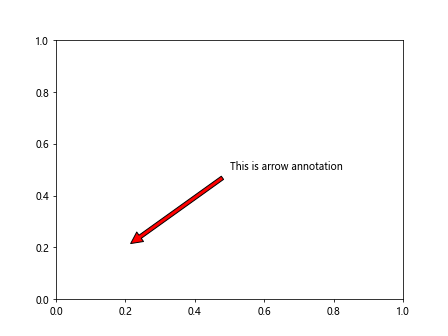
运行上面的代码,可以看到在图中从(0.2, 0.2)指向(0.5, 0.5)的位置添加了一个带有红色箭头的文本注释。
3. 修改注释的样式和字体
我们可以通过传递额外的参数来修改注释的样式和字体。下面的代码演示了如何设置注释文本的字体大小、颜色和样式。
import matplotlib.pyplot as plt

fig, ax = plt.subplots()
ax.annotate('This is customized annotation', (0.3, 0.3),
            fontsize=12, color='blue', style='italic')

plt.show()
Output:
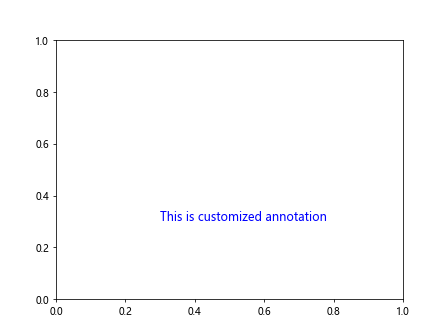
运行上述代码,可以看到一个蓝色斜体字体大小为12的文本注释。
4. 在图中不同坐标轴上添加注释
有时候,我们希望在图中不同的坐标轴上添加注释。下面的代码演示了如何在图中横坐标轴和纵坐标轴上添加注释。
import matplotlib.pyplot as plt

fig, ax = plt.subplots()
ax.annotate('X-axis annotation', (0.5, 0), xycoords='axes fraction',
            fontsize=12, color='green', ha='center')
ax.annotate('Y-axis annotation', (0, 0.5), xycoords='axes fraction',
            fontsize=12, color='purple', va='center', rotation=90)

plt.show()
Output:
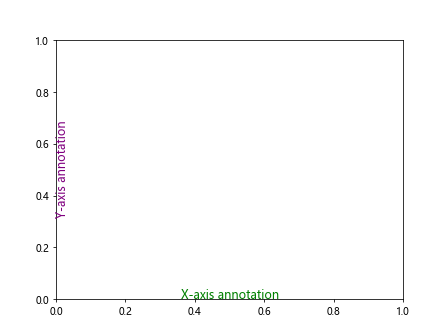
运行上述代码,可以看到在图中横坐标轴中心和纵坐标轴中心分别添加了绿色和紫色的注释。
5. 在图中添加多个注释
有时候,我们可能需要在图中添加多个注释。下面的代码演示了如何在图中同时添加多个文本注释。
import matplotlib.pyplot as plt

fig, ax = plt.subplots()
ax.annotate('Annotation 1', (0.2, 0.2), xytext=(0.5, 0.5),
            arrowprops=dict(facecolor='red', shrink=0.05))
ax.annotate('Annotation 2', (0.5, 0.5), xytext=(0.8, 0.8),
            arrowprops=dict(facecolor='blue', shrink=0.05))

plt.show()
Output:
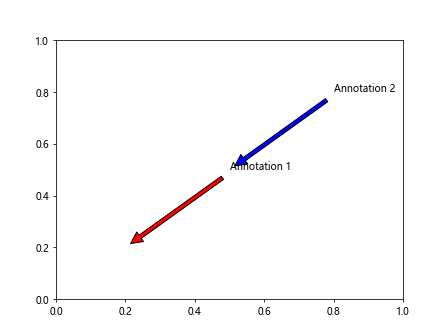
运行上述代码,可以看到在图中同时出现了两个带箭头的文本注释。
6. 在图中添加图像注释
除了文本注释,我们还可以在图中添加图像注释。下面的代码演示了如何在图中添加一个Matplotlib图标。
import matplotlib.pyplot as plt
import matplotlib.image as mpimg

fig, ax = plt.subplots()

# 读取Matplotlib图标
img = mpimg.imread('https://matplotlib.org/stable/_static/logo2_compressed.svg')
im = ax.imshow(img, aspect='auto', extent=(0.2, 0.8, 0.2, 0.8))

# 添加图像注释
ax.annotate('Matplotlib Logo', (0.5, 0.5),
            xytext=(0.5, 0.2), textcoords='axes fraction',
            fontsize=12, color='black', ha='center')

plt.show()
运行上述代码,可以看到在图中添加了Matplotlib官方Logo的图像注释。
7. 在柱状图中添加注释
在柱状图中添加注释是很常见的需求。下面的代码演示了如何在柱状图中的每个柱子上方添加数值标签。
import matplotlib.pyplot as plt

# 数据
categories = ['A', 'B', 'C', 'D']
values = [10, 20, 30, 40]

fig, ax = plt.subplots()
bars = ax.bar(categories, values)

# 添加数值标签
for bar in bars:
    height = bar.get_height()
    ax.annotate(f'{height}', xy=(bar.get_x() + bar.get_width() / 2, height),
                xytext=(0, 3),  # 3 points vertical offset
                textcoords="offset points",
                ha='center', va='bottom')

plt.show()
Output:
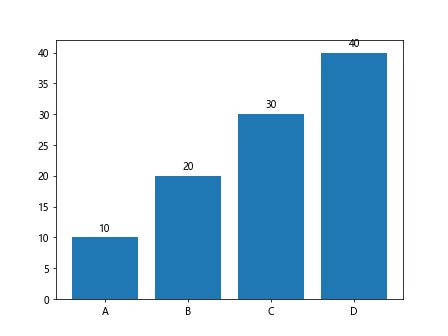
运行上述代码,可以看到在柱状图的每个柱子上方添加了对应的数值标签。
8. 在散点图中添加注释
在散点图中添加注释可以帮助我们标识出特定的数据点。下面的代码演示了如何在散点图中添加标记注释。
import matplotlib.pyplot as plt

# 数据
x = [1, 2, 3, 4, 5]
y = [3, 5, 2, 7, 6]

fig, ax = plt.subplots()
ax.scatter(x, y)

# 添加标记注释
for i, txt in enumerate(['point1', 'point2', 'point3', 'point4', 'point5']):
    ax.annotate(txt, (x[i], y[i]), fontsize=8, color='red')

plt.show()
Output:
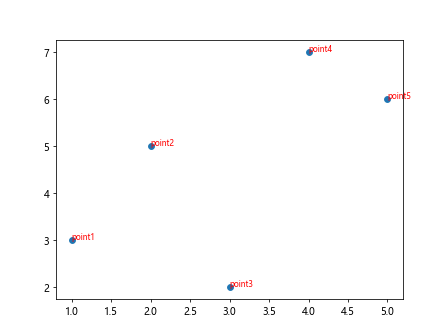
运行上述代码,可以看到在散点图中标记出了每个数据点的名字。
9. 在线型图中添加注释
在线型图中添加注释可以帮助观众更好地理解图表中的信息。下面的代码演示了如何在线型图上添加注释箭头。
import matplotlib.pyplot as plt

# 数据
x = [1, 2, 3, 4, 5]
y = [3, 5, 2, 7, 6]

fig, ax = plt.subplots()
ax.plot(x, y)

# 添加注释箭头
ax.annotate('Annotation', (3, 5), xytext=(4, 4),
            arrowprops=dict(arrowstyle='->', color='purple'))

plt.show()
Output:
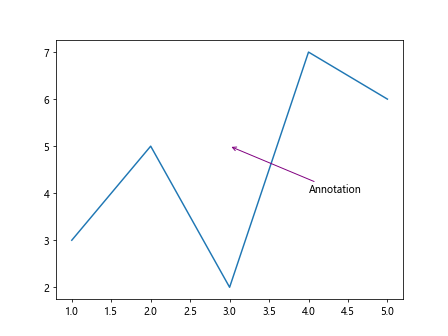
运行上述代码,可以看到在线型图中添加了一个紫色箭头的注## 10. 在饼图中添加注释
在饼图中添加注释可以帮助我们突出特定部分的数据。下面的代码演示了如何在饼图中添加标签注释。
import matplotlib.pyplot as plt

# 数据
sizes = [20, 30, 25, 25]
labels = ['A', 'B', 'C', 'D']

fig, ax = plt.subplots()
ax.pie(sizes, labels=labels, autopct='%1.1f%%')

# 添加标签注释
for i, size in enumerate(sizes):
    ax.annotate(f'{labels[i]}: {size}%', xy=(0, 0), va='center', ha='center')

plt.show()
Output:
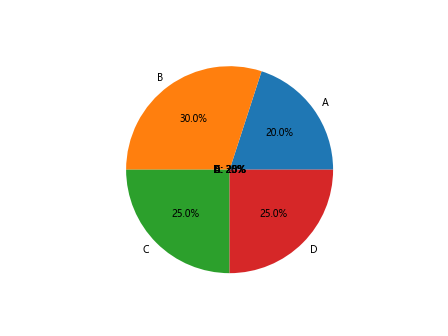
运行上述代码,可以看到在饼图中标记出了每个数据部分的百分比。
11. 在雷达图中添加注释
在雷达图中添加注释可以帮助我们更直观地展示数据。下面的代码演示了如何在雷达图中添加注释箭头。
import matplotlib.pyplot as plt
import numpy as np

# 数据
labels = ['A', 'B', 'C', 'D']
values = [1, 2, 3, 4]

# 构建雷达图
fig, ax = plt.subplots(subplot_kw={'polar': True})
theta = np.linspace(0, 2*np.pi, len(labels), endpoint=False)
values += values[:1]
ax.fill(theta, values, 'b', alpha=0.1)

# 添加注释箭头
for i in range(len(labels)):
    ax.annotate(labels[i], (theta[i], values[i]), fontsize=12,
                xytext=(theta[i] - 0.2, values[i] + 0.5), textcoords='polar')

plt.show()
运行上述代码,可以看到在雷达图中添加了标签注释箭头。
12. 在热力图中添加注释
在热力图中添加注释可以帮助我们更清晰地表达数据热度。下面的代码演示了如何在热力图中添加数值标签。
import matplotlib.pyplot as plt
import numpy as np

# 生成数据
data = np.random.rand(5, 5)

fig, ax = plt.subplots()
im = ax.imshow(data)

# 添加数值标签
for i in range(5):
    for j in range(5):
        ax.text(j, i, f'{data[i, j]:.2f}', ha='center', va='center', color='black')

plt.show()
Output:
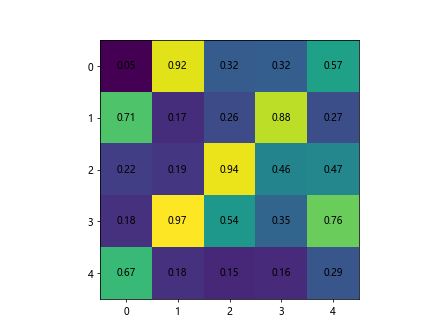
运行上述代码,可以看到在热力图中添加了每个格子的数值标签。
13. 在3D图中添加注释
在3D图中添加注释可以帮助我们更好地理解数据。下面的代码演示了如何在3D散点图中添加标记注释。
import matplotlib.pyplot as plt
import numpy as np

# 生成数据
x = np.random.rand(100)
y = np.random.rand(100)
z = np.random.rand(100)

fig = plt.figure()
ax = fig.add_subplot(111, projection='3d')
scatter = ax.scatter(x, y, z)

# 添加标记注释
for i in range(10):
    ax.text(x[i], y[i], z[i], f'Point {i}', color='red')

plt.show()
Output:
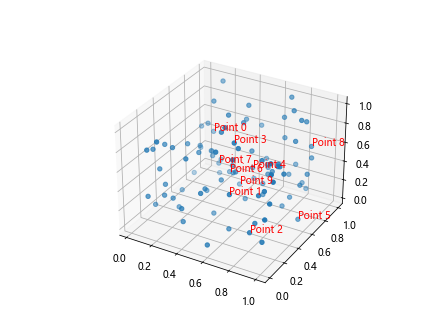
运行上述代码,可以看到在3D散点图中显示了每个数据点的标记注释。
14. 在Subplot中添加注释
在Subplot中添加注释可以帮助我们更好地展示多个图表之间的关联。下面的代码演示了如何在Subplot中添加注释。
import matplotlib.pyplot as plt

fig, axs = plt.subplots(2, 2)

# 添加文本注释
axs[0, 0].annotate('Subplot 1', (0.5, 0.5), ha='center', va='center')
axs[0, 1].annotate('Subplot 2', (0.5, 0.5), ha='center', va='center')
axs[1, 0].annotate('Subplot 3', (0.5, 0.5), ha='center', va='center')
axs[1, 1].annotate('Subplot 4', (0.5, 0.5), ha='center', va='center')

plt.show()
Output:
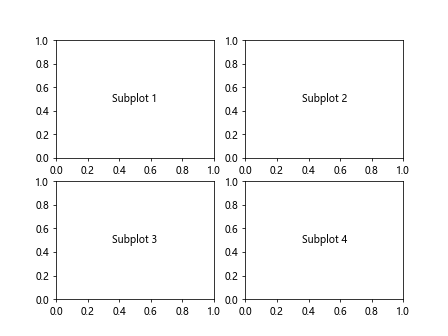
运行上述代码,可以看到在一个包含4个Subplot的图表中添加了注释。
结论
在本文中,我们详绚介绍了如何使用Matplotlib库中的ax.annotate方法来添加注释到图表中。我们展示了不同类型的注释,包括文本注释、箭头注释、图像注释等,并给出了相应的示例代码和运行结果。添加注释是数据可视化中的重要技巧,可以帮助我们更好地表达数据和信息。
 极客教程
极客教程