Matplotlib ax title subplot
在Matplotlib中,我们经常需要在图形中添加标题和子图。在本文中,我们将详细介绍如何使用Matplotlib中的ax.title和ax.subplot功能来实现这些目标。
添加主标题
首先,让我们看看如何为图形添加主标题。在Matplotlib中,我们可以使用ax.title.set_text()方法来设置图形的主标题。下面是一个简单的示例代码:
import matplotlib.pyplot as plt

fig, ax = plt.subplots()
ax.plot([1, 2, 3, 4], [1, 4, 9, 16])

ax.title.set_text("Example Title")

plt.show()
Output:
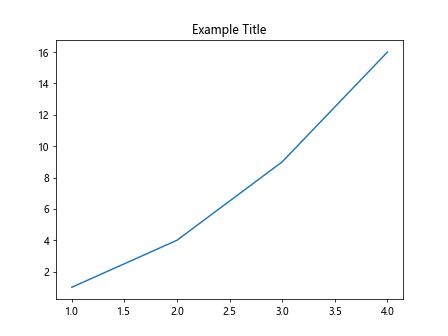
在这个示例中,我们创建了一个简单的图形,然后使用ax.title.set_text()方法设置了主标题为”Example Title”。运行代码后,你将在图形中看到这个主标题。
添加子图
接下来,让我们看看如何在Matplotlib图形中添加子图。我们可以使用subplot()方法来创建子图。下面是一个示例代码:
import matplotlib.pyplot as plt

fig, (ax1, ax2) = plt.subplots(1, 2)
ax1.plot([1, 2, 3, 4], [1, 4, 9, 16])
ax2.plot([1, 2, 3, 4], [1, 2, 3, 4])

ax1.title.set_text("Subplot 1")
ax2.title.set_text("Subplot 2")

plt.show()
Output:
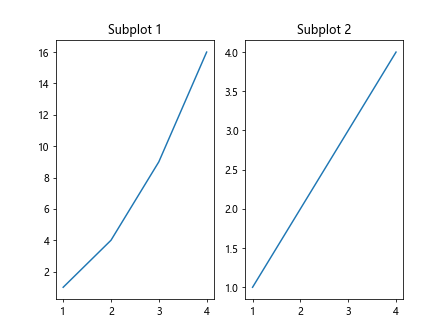
在这个示例中,我们创建了一个包含两个子图的图形。我们使用subplot()方法创建了这两个子图,并使用ax1.title.set_text()和ax2.title.set_text()方法分别为它们设置了标题。运行代码后,你将在图形中看到这两个子图及其标题。
自定义标题样式
除了设置标题文本外,我们还可以对标题的样式进行自定义。我们可以使用set_color()、set_fontsize()、set_fontweight()等方法来调整标题的颜色、字体大小和字体粗细。下面是一个示例代码:
import matplotlib.pyplot as plt

fig, ax = plt.subplots()
ax.plot([1, 2, 3, 4], [1, 4, 9, 16])

title = ax.title
title.set_text("Customized Title")
title.set_color('red')
title.set_fontsize(20)
title.set_fontweight('bold')

plt.show()
Output:

在这个示例中,我们首先创建了一个简单的图形,然后获取了标题对象并对其进行了自定义设置。我们设置了标题文本为”Customized Title”,颜色为红色,字体大小为20,字体粗细为粗体。运行代码后,你将看到标题以自定义的样式显示在图形中。
多行标题
有时我们可能需要在标题中显示多行文本。在Matplotlib中,我们可以使用\n来换行。下面是一个示例代码:
import matplotlib.pyplot as plt

fig, ax = plt.subplots()
ax.plot([1, 2, 3, 4], [1, 4, 9, 16])

ax.title.set_text("Line 1\nLine 2")

plt.show()
Output:
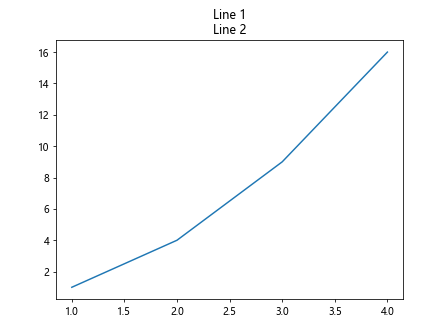
在这个示例中,我们将标题文本设置为”Line 1\nLine 2″,其中\n表示换行。运行代码后,你将看到标题显示为两行文本。
设置子图标题位置
除了为子图设置标题外,我们还可以调整子图标题的位置。在Matplotlib中,我们可以使用set_position()方法来设置标题的位置。下面是一个示例代码:
import matplotlib.pyplot as plt

fig, ax = plt.subplots()
ax.plot([1, 2, 3, 4], [1, 4, 9, 16])

ax.title.set_text("Title at (0.5, 0.5)")
ax.title.set_position((0.5, 0.5))

plt.show()
Output:
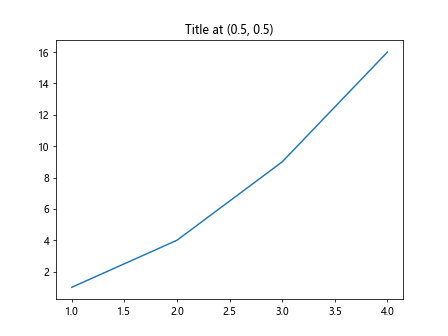
在这个示例中,我们将标题文本设置为”Title at (0.5, 0.5)”,并使用set_position()方法将标题位置设置在图形的中心(0.5, 0.5)。运行代码后,你将看到标题位于图形的中心位置。
多个子图的标题位置
在包含多个子图的图形中,我们可以针对每个子图分别设置标题的位置。下面是一个示例代码:
import matplotlib.pyplot as plt

fig, ((ax1, ax2), (ax3, ax4)) = plt.subplots(2, 2)
ax1.plot([1, 2, 3, 4], [1, 4, 9, 16])
ax2.plot([1, 2, 3, 4], [1, 2, 3, 4])
ax3.plot([1, 2, 3, 4], [1, 2, 4, 8])
ax4.plot([1, 2, 3, 4], [4, 2, 1, 0])

ax1.title.set_text("Title 1")
ax2.title.set_text("Title 2")
ax3.title.set_text("Title 3")
ax4.title.set_text("Title 4")

ax1.title.set_position((0.5, 0.5))
ax2.title.set_position((0.3, 0.7))
ax3.title.set_position((0.1, 0.9))
ax4.title.set_position((0.7, 0.3))

plt.show()
Output:
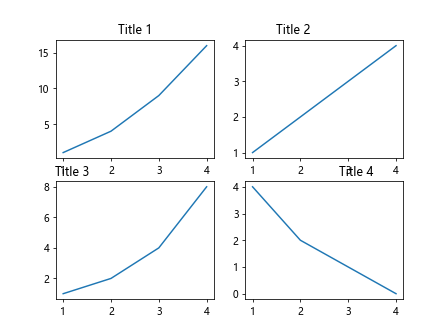
在这个示例中,我们创建了一个包含四个子图的图形,并分别为每个子图设置了标题和位置。通过设置不同的位置,我们可以将每个子图的标题放置在不同的位置上。
隐藏标题
有时候我们可能需要隐藏标题,这时可以使用set_visible()方法将标题设置为不可见。下面是一个示例代码:
import matplotlib.pyplot as plt

fig, ax = plt.subplots()
ax.plot([1, 2, 3, 4], [1, 4, 9, 16])

ax.title.set_text("Hidden Title")
ax.title.set_visible(False)

plt.show()
Output:
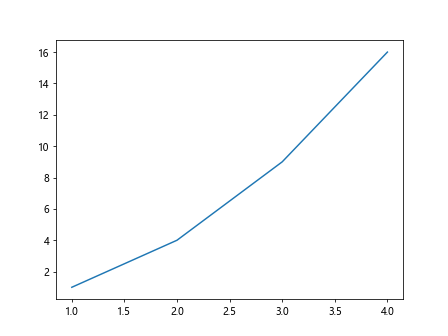
在这个示例中,我们为图形设置了标题为”Hidden Title”,然后使用set_visible()方法将标题设置为不可见。运行代码后,你将看不到标题显示在图形中。
设置标题对齐方式
我们还可以调整标题的对齐方式,包括水平对齐和垂直对齐。在Matplotlib中,我们可以使用set_horizontalalignment()和set_verticalalignment()方法来设置对齐方式。下面是一个示例代码:
import matplotlib.pyplot as plt

fig, ax = plt.subplots()
ax.plot([1, 2, 3, 4], [1, 4, 9, 16])

title = ax.title
title.set_text("Centered Title")
title.set_horizontalalignment('center')
title.set_verticalalignment('center')

plt.show()
Output:
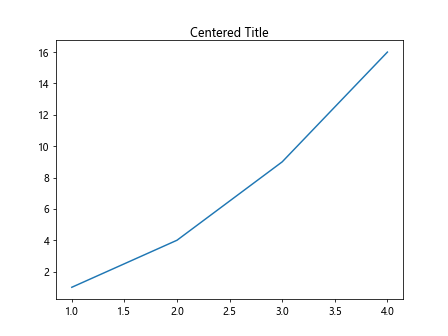
在这个示例中,我们将标题文本设置为”Centered Title”,并通过set_horizontalalignment()和set_verticalalignment()方法将标题水平和垂直对齐方式设置为居中。运行代码后,你将看到标题处于图形的中心位置上。
设置标题旋转角度
我们还可以设置标题的旋转角度。在Matplotlib中,我们可以使用set_rotation()和set_rotation_mode()方法来设置标题的旋转角度和旋转模式。下面是一个示例代码:
import matplotlib.pyplot as plt

fig, ax = plt.subplots()
ax.plot([1, 2, 3, 4], [1, 4, 9, 16])

title = ax.title
title.set_text("Rotated Title")
title.set_rotation(45)
title.set_rotation_mode('anchor')

plt.show()
Output:
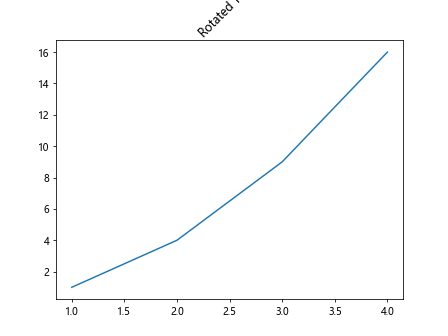
在这个示例中,我们将标题文本设置为”Rotated Title”,并使用set_rotation()方法将标题旋转角度设置为45度。同时,我们还使用set_rotation_mode(‘anchor’)方法指定了旋转模式为锚定旋转。运行代码后,你将看到标题以45度角度旋转在图形中。
多个标题一起设置
有时候我们可能需要将多个标题一起设置,比如将子图标题和主标题一起设置。在Matplotlib中,我们可以同时设置所有的标题,然后逐个调整其样式。下面是一个示例代码:
import matplotlib.pyplot as plt

fig, (ax1, ax2) = plt.subplots(1, 2)
ax1.plot([1, 2, 3, 4], [1, 4, 9, 16])
ax2.plot([1, 2, 3, 4], [1, 2, 3, 4])

fig.suptitle("Main Title")

for ax in [ax1, ax2]:
    ax.title.set_color('blue')
    ax.title.set_fontsize(16)

plt.show()
Output:
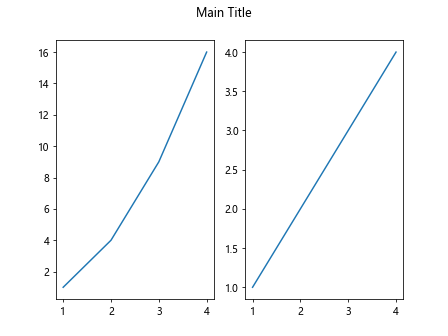
在这个示例中,我们创建了一个包含两个子图的图形,并使用fig.suptitle()方法设置了主标题为”Main Title”。然后我们遍历了每个子图,分别为其设置标题颜色和字体大小。运行代码后,你将看到主标题和子图标题一起显示在图形中。
灰色主标题,黑色子图标题
有时候我们可能需要为主标题和子图标题设置不同的颜色。在Matplotlib中,我们可以分别调整每一个标题的颜色。下面是一个示例代码:
import matplotlib.pyplot as plt

fig, (ax1, ax2) = plt.subplots(1, 2)
ax1.plot([1, 2, 3, 4], [1, 4, 9, 16])
ax2.plot([1, 2, 3, 4], [1, 2, 3, 4])

fig.suptitle("Main Title", color='gray')

ax1.title.set_text("Subplot 1")
ax2.title.set_text("Subplot 2")
ax1.title.set_color('black')
ax2.title.set_color('black')

plt.show()
Output:
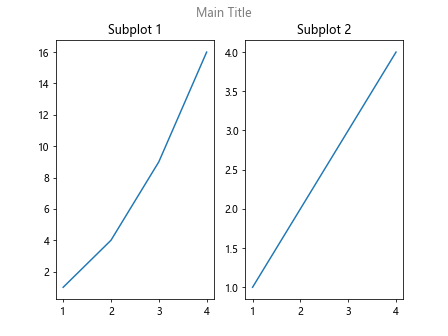
在这个示例中,我们创建了一个包含两个子图的图形,并使用fig.suptitle()方法设置了主标题为”Main Title”,颜色设置为灰色。然后我们分别为每个子图设置了黑色的标题。运行代码后,你将看到主标题为灰色,子图标题为黑色显示在图形中。
通过本文的详细介绍,我们可以看到如何在Matplotlib中使用ax.title和ax.subplot功能来管理图形的标题和子图。通过掌握这些功能,我们可以灵活地设置图形标题和子图,从而使图形更加直观且具有更好的可读性。
 极客教程
极客教程