如何使用ax.scatter方法来添加标签
在使用Matplotlib绘图时,我们经常会用到scatter方法来绘制散点图。而在scatter方法中,有一个很重要的参数叫做label,它可以用来标记每个散点的标签。本文将详细介绍如何使用ax.scatter方法来添加标签。首先我们需要导入必要的库:
import matplotlib.pyplot as plt
import numpy as np
1. 添加简单标签
我们首先来看一个简单的示例,如何使用label参数来添加标签:
import matplotlib.pyplot as plt
import numpy as np

x = np.random.rand(10)
y = np.random.rand(10)
labels = ['A', 'B', 'C', 'D', 'E', 'F', 'G', 'H', 'I', 'J']

fig, ax = plt.subplots()
ax.scatter(x, y, label='Scatter Plot')
for i, label in enumerate(labels):
    ax.text(x[i], y[i], label)
ax.legend()
plt.show()
Output:
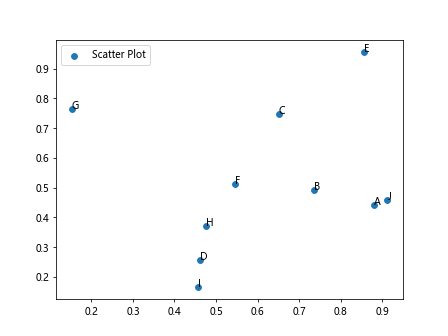
在这个示例中,我们首先生成了10个随机的x,y坐标,然后定义了10个标签。接着使用ax.scatter方法绘制散点图,并通过遍历labels列表,在每个散点上添加对应的标签。
2. 自定义标签样式
除了简单的文字标签外,我们还可以自定义标签的样式,比如颜色、大小、字体等等。下面是一个示例代码:
import matplotlib.pyplot as plt
import numpy as np

x = np.linspace(0, 10, 50)
y = np.sin(x)

fig, ax = plt.subplots()
scatter = ax.scatter(x, y, label='Scatter Plot')
ax.set_title('Custom Labels')
for i, txt in enumerate(np.round(y, 2)):
    ax.annotate(txt, (x[i], y[i]), color='red', fontsize=10, fontweight='bold')
ax.legend()
plt.show()
Output:
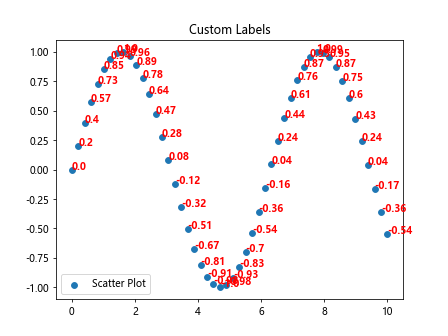
这个示例中,我们使用了annotate方法来添加标签,同时指定了标签的颜色为红色,字体大小为10,字体加粗。
3. 添加交互式标签
有时候我们希望标签能够在鼠标悬停时显示出来,这就需要使用hoverlabel工具。示例如下:
import matplotlib.pyplot as plt
import numpy as np

x = np.random.rand(10)
y = np.random.rand(10)
labels = ['A', 'B', 'C', 'D', 'E', 'F', 'G', 'H', 'I', 'J']

fig, ax = plt.subplots()
scatter = ax.scatter(x, y, label='Scatter Plot')
ax.set_title('Interactive Labels')
for i, label in enumerate(labels):
    ax.text(x[i], y[i], label)
def on_hover(event):
    for i in range(len(x)):
        if scatter.contains(event)[0]:
            ax.annotate(labels[i], (x[i], y[i]), xytext=(x[i]+0.1, y[i]+0.1), arrowprops=dict(arrowstyle='->'))
            fig.canvas.draw_idle()
fig.canvas.mpl_connect('motion_notify_event', on_hover)
ax.legend()
plt.show()
Output:
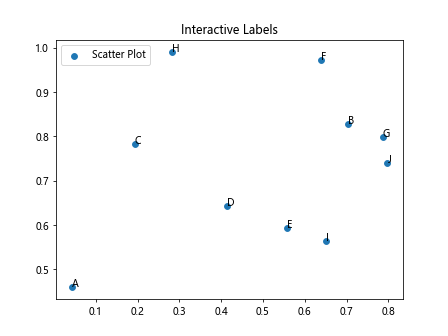
在这个示例中,我们首先创建了一个散点图,然后定义了一个on_hover函数,当鼠标悬停在某一个散点上时,会在该点处显示相应的标签,并添加箭头指向散点。
4. 使用pandas数据添加标签
如果我们的数据是存储在pandas的DataFrame中,我们也可以很方便地使用label参数来添加标签。示例如下:
import pandas as pd
import matplotlib.pyplot as plt
import numpy as np

df = pd.DataFrame({
    'X': np.random.rand(10),
    'Y': np.random.rand(10),
    'Label': ['A', 'B', 'C', 'D', 'E', 'F', 'G', 'H', 'I', 'J']
})

fig, ax = plt.subplots()
ax.scatter('X', 'Y', data=df, label='Scatter Plot')
for i, point in df.iterrows():
    ax.text(point['X'], point['Y'], point['Label'])
ax.legend()
plt.show()
Output:
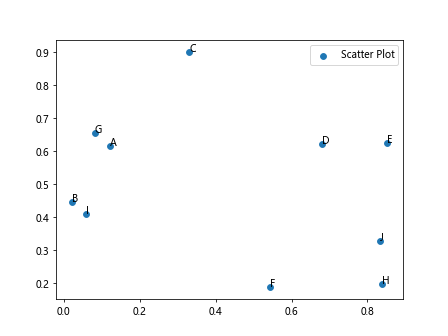
在这个示例中,我们首先创建了一个包含X、Y坐标和标签的DataFrame,并使用ax.scatter方法绘制散点图。然后通过遍历DataFrame中的行来为每个散点添加标签。
5. 添加标签箭头
有时候我们希望标签上有一个箭头指向对应的散点,这时可以使用arrowprops参数。示例如下:
import matplotlib.pyplot as plt
import numpy as np

x = np.random.rand(10)
y = np.random.rand(10)
labels = ['A', 'B', 'C', 'D', 'E', 'F', 'G', 'H', 'I', 'J']

fig, ax = plt.subplots()
scatter = ax.scatter(x, y, label='Scatter Plot')
for i, label in enumerate(labels):
    ax.text(x[i], y[i], label, arrowprops=dict(arrowstyle='->', color='red'))
ax.legend()
plt.show()
在这个示例中,我们在标签文本旁边添加了一个红色的箭头,指向对应的散点。
6. 使用不同的标签方向
有时候我们希望标签的方向不一样,比如水平或垂直。这时可以通过rotation参数来实现。示例如下:
import matplotlib.pyplot as plt
import numpy as np

x = np.random.rand(10)
y = np.random.rand(10)
labels = ['A', 'B', 'C', 'D', 'E', 'F', 'G', 'H', 'I', 'J']

fig, ax = plt.subplots()
scatter = ax.scatter(x, y, label='Scatter Plot')
for i, label in enumerate(labels):
    ax.text(x[i], y[i], label, rotation=45)
ax.legend()
plt.show()
Output:
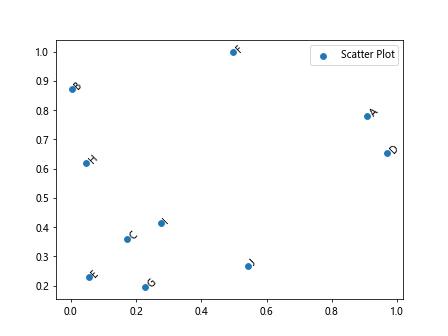
在这个示例中,我们通过rotation参数将标签旋转了45度。
7. 添加背景色
有时候我们希望标签有一个背景色,这时可以通过bbox参数来实现。示例如下:
import matplotlib.pyplot as plt
import numpy as np

x = np.random.rand(10)
y = np.random.rand(10)
labels = ['A', 'B', 'C', 'D', 'E', 'F', 'G', 'H', 'I', 'J']

fig, ax = plt.subplots()
scatter = ax.scatter(x, y, label='Scatter Plot')
for i, label in enumerate(labels):
    ax.text(x[i], y[i], label, bbox=dict(facecolor='red', alpha=0.5))
ax.legend()
plt.show()
Output:
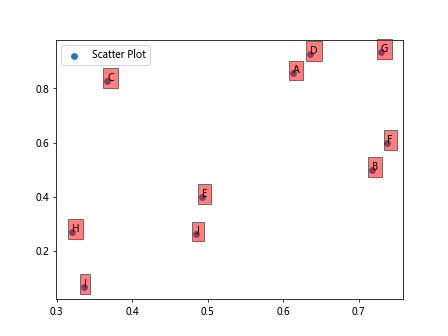
在这个示例中,我们将标签的背景色设置为红色,透明度为0.5。
8. 隐藏部分标签
有时候我们的散点图上有太多的标签,为了避免拥挤可以选择隐藏一部分标签。示例如下:
import matplotlib.pyplot as plt
import numpy as np

x = np.random.rand(10)
y = np.random.rand(10)
labels = ['A', 'B', 'C', 'D', 'E', 'F', 'G', 'H', 'I', 'J']

fig, ax = plt.subplots()
scatter = ax.scatter(x, y, label='Scatter Plot')
for i, label in enumerate(labels):
    if i % 2 == 0:
        ax.text(x[i], y[i], label)
ax.legend()
plt.show()
Output:
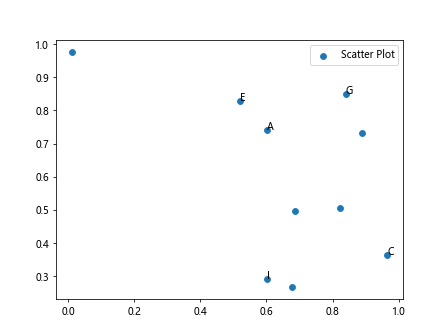
在这个示例中,我们只显示索引为偶数的标签。
9. 标签位置偏移
有时候我们想要在标签位置进行微小的偏移,可以通过xy参数实现。示例如下:
import matplotlib.pyplot as plt
import numpy as np

x = np.random.rand(10)
y = np.random.rand(10)
labels = ['A', 'B', 'C', 'D', 'E', 'F', 'G', 'H', 'I', 'J']

fig, ax = plt.subplots()
scatter = ax.scatter(x, y, label='Scatter Plot')
for i, label in enumerate(labels):
    ax.text(x[i], y[i], label, xy=(x[i]+0.02, y[i]+0.02))
ax.legend()
plt.show()
在这个示例中,我们将标签的位置微调了0.02。
10. 添加带箭头的标签
有时候我们想要为标签添加一条带箭头的线,指向对应的散点。这时可以结合annotate方法和arrowprops参数来实现。示例如下:
import matplotlib.pyplot as plt
import numpy as np

x = np.random.rand(10)
y = np.random.rand(10)
labels = ['A', 'B', 'C', 'D', 'E', 'F', 'G', 'H', 'I', 'J']

fig, ax = plt.subplots()
scatter = ax.scatter(x, y, label='Scatter Plot')
for i, label in enumerate(labels):
    ax.annotate(label, (x[i], y[i]), xytext=(x[i]+0.1, y[i]+0.1), arrowprops=dict(arrowstyle='->'))
ax.legend()
plt.show()
Output:
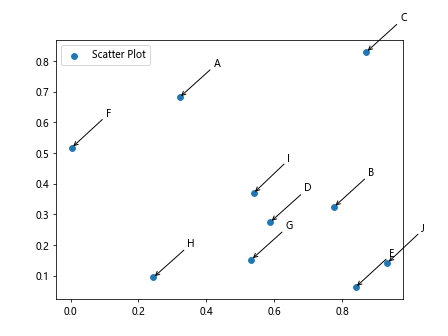
在这个示例中,我们使用annotate方法实现带箭头的标签。
 极客教程
极客教程