Annotate Arrow Matplotlib
在Matplotlib中,annotate箭头是一个很有用的功能,用于在图形中标记指定位置并指向特定的数据点。本文将详细介绍如何在Matplotlib中使用annotate箭头功能,并提供丰富的示例代码演示。让我们一起来探索吧!
基础用法
首先,让我们看看如何基础地在Matplotlib中使用annotate箭头功能。在下面的示例代码中,我们将在图形中标记一个点,并用箭头指向另一个点。
import matplotlib.pyplot as plt

x = [1, 2, 3]
y = [2, 3, 1]

plt.plot(x, y, 'bo')
plt.annotate('Here', (2, 3), xytext=(2.5, 2.5), arrowprops=dict(facecolor='black', shrink=0.05))
plt.show()
Output:
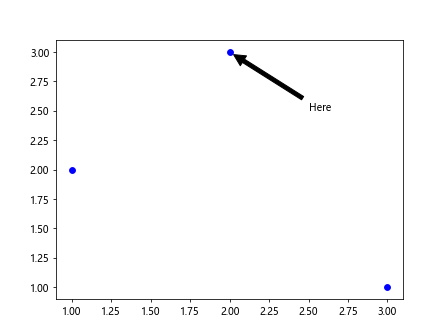
在这个示例中,我们使用annotate函数在坐标(2, 3)处添加文本”Here”,并指向这个点。箭头的起始位置使用xy参数指定,箭头的末端位置使用xytext参数指定。
自定义箭头样式
Matplotlib允许我们自定义箭头的样式,如箭头形状、颜色、大小等。在下面的示例中,我们将演示如何自定义箭头样式。
import matplotlib.pyplot as plt

x = [1, 2, 3]
y = [2, 3, 1]

plt.plot(x, y, 'bo')
plt.annotate('Custom Arrow', (2, 3), xytext=(2.5, 2.5), arrowprops=dict(arrowstyle='fancy', fc='red', ec='black', lw=2))
plt.show()
Output:
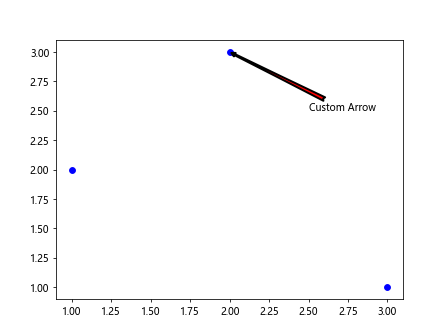
在这个示例中,我们使用arrowprops参数来自定义箭头的样式。可以通过设置arrowstyle、fc(箭头填充颜色)、ec(箭头边框颜色)和lw(箭头边框宽度)等参数来实现自定义箭头样式。
多个箭头
在Matplotlib中,我们还可以在图形中添加多个箭头,以突出不同的数据点之间的关系。在下面的示例中,我们将演示如何添加多个箭头。
import matplotlib.pyplot as plt

x = [1, 2, 3, 4]
y = [2, 3, 1, 4]

plt.plot(x, y, 'bo')
plt.annotate('Point 1', (2, 3), xytext=(2.5, 2.5), arrowprops=dict(facecolor='black', shrink=0.05))
plt.annotate('Point 2', (1, 2), xytext=(1.5, 1.5), arrowprops=dict(facecolor='blue', shrink=0.05))
plt.show()
Output:
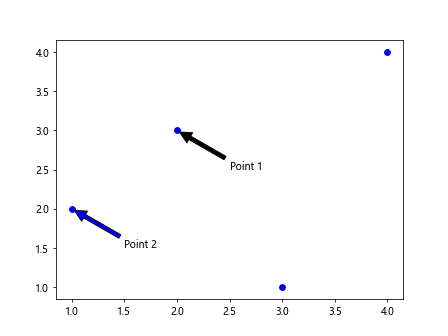
在这个示例中,我们使用两次annotate函数分别在点(2, 3)和点(1, 2)处添加文本,并分别用箭头指向这两个点,实现了多个箭头的效果。
坐标系转换
有时候我们需要将坐标系进行转换,以便在不同的坐标系中添加箭头。在Matplotlib中,我们可以使用transData、transAxes、transFigure等方法实现坐标系转换。下面是一个示例代码演示坐标系转换。
import matplotlib.pyplot as plt

fig, ax = plt.subplots()

# 添加箭头至指定点(0.4, 0.6)并设置箭头的起始位置(0.1, 0.1)
ax.annotate('Coordinate Transform', xy=(0.4, 0.6), xytext=(0.1, 0.1),
            arrowprops=dict(facecolor='green', shrink=0.05),
            xycoords='data', textcoords='data')

plt.show()
Output:
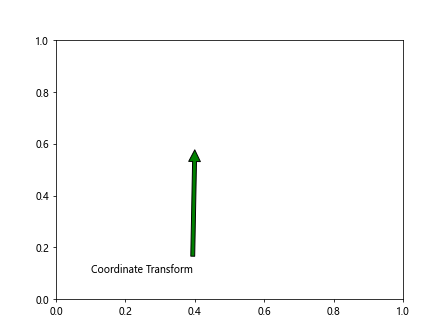
在这个示例中,我们使用xycoords和textcoords参数来指定箭头和文本的坐标系,这里都使用的是’data’表示data坐标系。
图形边界
当我们在图形中添加箭头时,有时候会希望箭头始终在图形的边界内。Matplotlib提供了clip_on参数来实现这个功能,下面是一个示例代码。
import matplotlib.pyplot as plt

x = [1, 2, 3, 4]
y = [2, 3, 1, 4]

plt.plot(x, y, 'bo')
plt.annotate('Within Boundaries', (2, 3), xytext=(2.5, 2.5),
             arrowprops=dict(facecolor='black', shrink=0.05, clip_on=True))
plt.show()
Output:
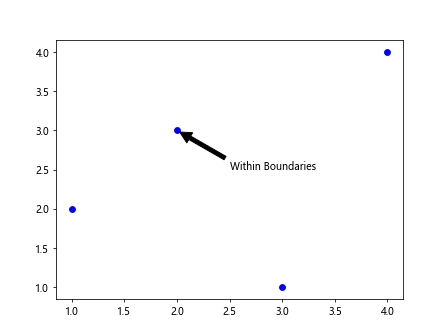
在这个示例中,我们通过设置clip_on=True来确保箭头始终在图形的边界内显示,不会超出边界。
多个字体和颜色
Matplotlib允许我们在annotate箭头中使用不同的字体和颜色来突出文本。下面是一个示例代码演示多个字体和颜色。
import matplotlib.pyplot as plt

x = [1, 2, 3]
y = [2, 3, 1]

plt.plot(x, y, 'bo')
plt.annotate('Bold Red', (2, 3), xytext=(2.5, 2.5),
             arrowprops=dict(facecolor='black', shrink=0.05),
             fontweight='bold', color='red')
plt.show()
Output:
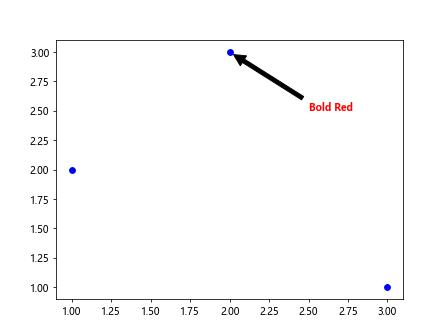
在这个示例中,我们使用fontweight和color参数来设置文本的字体粗细和颜色,实现了多种字体和颜色的效果。
包含HTML文本
有时候我们在annotate箭头中希望包含一些HTML文本,以展示更加丰富的内容。Matplotlib允许我们在文本框中包含HTML文本,下面是一个示例代码演示包含HTML文本。
import matplotlib.pyplot as plt

x = [1, 2, 3]
y = [2, 3, 1]

plt.plot(x, y, 'bo')
plt.annotate('HTML Text', (2, 3), xytext=(2.5, 2.5),
             arrowprops=dict(facecolor='black', shrink=0.05),
             annotation_clip=False, fontsize=12, fontstyle='italic')
plt.show()
Output:
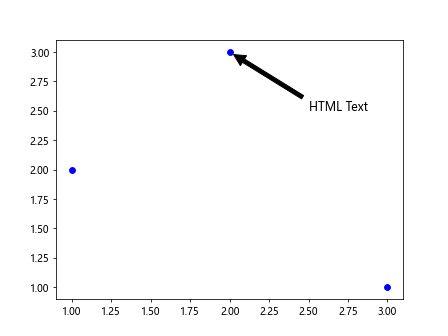
在这个示例中,我们使用annotation_clip=False来允许包含HTML文本在文本框中显示,同时使用fontsize和fontstyle参数设置文本的大小和样式。
倾斜文本
有时候我们希望在annotate箭头中倾斜一些文本,以便更好地显示。Matplotlib提供了rotation参数来实现文本的倾斜,下面是一个示例代码演示倾斜文本。
import matplotlib.pyplot as plt

x = [1, 2, 3]
y = [2, 3, 1]

plt.plot(x, y, 'bo')
plt.annotate('Slanted Text', (2, 3), xytext=(2.5, 2.5),
             arrowprops=dict(facecolor='black', shrink=0.05),
             rotation=45)
plt.show()
Output:
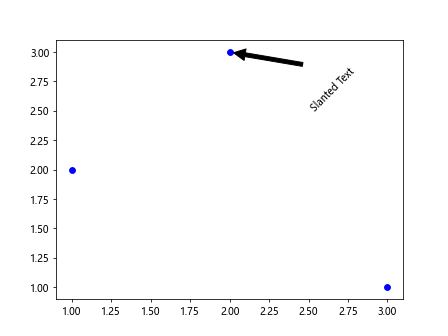
在这个示例中,我们使用rotation参数设置文本的倾斜角度,这里设置为45度,实现了倾斜文本的效果。
注释框样式
除了箭头的样式,我们还可以自定义注释框的样式,如填充颜色、边框颜色和透明度等。下面是一个示例代码演示自定义注释框样式。
import matplotlib.pyplot as plt

x = [1, 2, 3]
y = [2, 3, 1]

plt.plot(x, y, 'bo')
box_props = dict(boxstyle='round,pad=0.3', fc='cyan', ec='blue', lw=2, alpha=0.5)
plt.annotate('Custom Box', (2, 3), xytext=(2.5, 2.5),
             arrowprops=dict(facecolor='black', shrink=0.05),
             bbox=box_props)
plt.show()
Output:
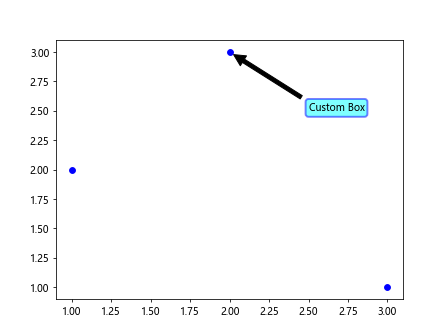
在这个示例中,我们使用boxstyle、fc(注释框填充颜色)、ec(注释框边框颜色)、lw(注释框边框宽度)和alpha(注释框透明度)参数来自定义注释框的样式,实现了自定义注释框样式的效果。
连接多个点
在Matplotlib中,我们还可以通过连接多个点来创建箭头路径,形成连续的箭头效果。下面是一个示例代码演示连接多个点创建箭头路径。
import matplotlib.pyplot as plt
from matplotlib.patches import FancyArrowPatch

x = [1, 2, 3, 4]
y = [2, 3, 1, 4]

plt.plot(x, y, 'bo')

arrow = FancyArrowPatch((1, 2), (4, 4), arrowstyle='->', mutation_scale=20,
                        color='purple', linestyle='dashed', linewidth=2)
plt.gca().add_patch(arrow)

plt.show()
Output:
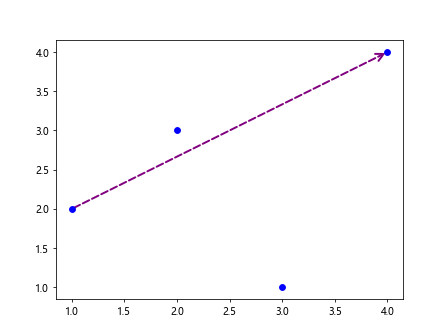
在这个示例中,我们使用FancyArrowPatch类来创建连续的箭头路径,连接了点(1, 2)和点(4, 4),箭头路径的样式包括箭头形状、颜色、线型和宽度等。
文本对齐方式
在annotate箭头中,我们还可以设置文本的对齐方式,包括水平对齐和垂直对齐。下面是一个示例代码演示文本的对齐方式。
import matplotlib.pyplot as plt

x = [1, 2, 3]
y = [2, 3, 1]

plt.plot(x, y, 'bo')
plt.annotate('Aligned Text', (2, 3), xytext=(2, 2),
             arrowprops=dict(facecolor='black', shrink=0.05),
             horizontalalignment='right', verticalalignment='top')
plt.show()
Output:
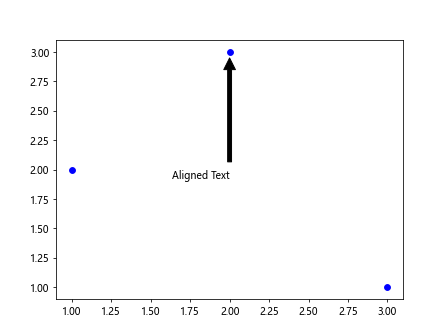
在这个示例中,我们使用horizontalalignment和verticalalignment参数来设置文本的水平对齐和垂直对齐方式,这里设置为右对齐和顶部对齐。
旋转箭头
在Matplotlib中,我们可以旋转箭头以改变箭头的方向,突出特定的数据点或关系。下面是一个示例代码演示旋转箭头。
import matplotlib.pyplot as plt

x = [1, 2, 3]
y = [2, 3, 1]

plt.plot(x, y, 'bo')
plt.annotate('Rotated Arrow', (2, 3), xytext=(2.5, 2.5),
             arrowprops=dict(facecolor='black', shrink=0.05, mutation_scale=20),
             rotation=45)
plt.show()
Output:
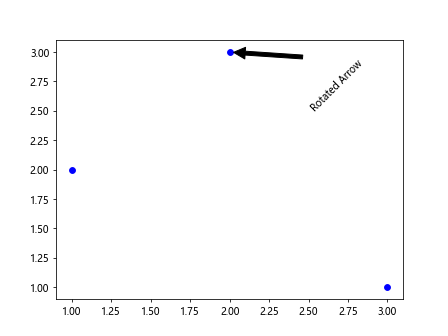
在这个示例中,我们使用rotation参数旋转箭头,这里设置为45度,实现了旋转箭头的效果。
删除箭头
在Matplotlib中,我们可以通过remove方法删除annotate箭头,以清除不需要的箭头标记。下面是一个示例代码演示删除箭头。
import matplotlib.pyplot as plt

x = [1, 2, 3]
y = [2, 3, 1]

plt.plot(x, y, 'bo')
arrow = plt.annotate('Delete Arrow', (2, 3), xytext=(2.5, 2.5),
                     arrowprops=dict(facecolor='black', shrink=0.05))
plt.show()

# 删除箭头
arrow.remove()
plt.show()
在这个示例中,我们通过remove方法删除了之前添加的箭头标记,从而清除了不需要的箭头。
通过以上示例,我们详细介绍了在Matplotlib中使用annotate箭头功能的各种用法,包括基础用法、自定义箭头样式、多个箭头、坐标系转换、图形边界、多个字体和颜色、包含HTML文本、倾斜文本等。
 极客教程
极客教程