Matplotlib动画散点图:如何创建生动的数据可视化
参考:Animating Scatter Plots in Matplotlib
Matplotlib是Python中最流行的数据可视化库之一,它不仅能够创建静态图表,还能制作动态的动画图表。在本文中,我们将深入探讨如何使用Matplotlib来创建动画散点图,这是一种非常有效的方式来展示数据随时间变化的趋势或模式。通过动画散点图,我们可以直观地观察数据点的移动、聚集或分散,从而更好地理解数据的动态特性。
1. 动画散点图的基础
要创建动画散点图,我们首先需要了解Matplotlib的动画模块。Matplotlib提供了animation模块,其中包含了创建动画所需的各种工具和类。最常用的是FuncAnimation类,它允许我们定义一个更新函数,该函数在每一帧都会被调用来更新图表。
让我们从一个简单的例子开始:
import numpy as np
import matplotlib.pyplot as plt
from matplotlib.animation import FuncAnimation

# 创建初始数据
x = np.random.rand(20)
y = np.random.rand(20)

# 创建图表和散点
fig, ax = plt.subplots()
scatter = ax.scatter(x, y)

# 定义更新函数
def update(frame):
    # 更新数据
    x = np.random.rand(20)
    y = np.random.rand(20)
    scatter.set_offsets(np.c_[x, y])
    return scatter,

# 创建动画
ani = FuncAnimation(fig, update, frames=200, interval=50, blit=True)

plt.title("How2matplotlib.com - Simple Animated Scatter")
plt.show()
Output:
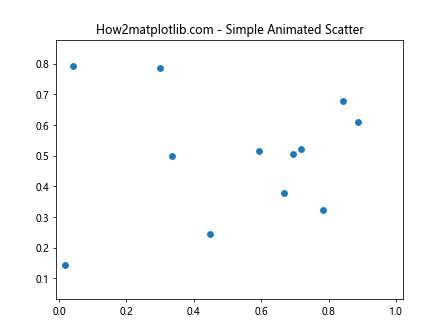
在这个例子中,我们首先创建了一些随机数据点。然后,我们定义了一个update函数,它在每一帧都会生成新的随机数据并更新散点的位置。FuncAnimation类用于创建动画,它会重复调用update函数来生成每一帧。
2. 自定义动画效果
虽然随机移动的散点已经很有趣,但在实际应用中,我们通常希望散点的移动能反映某种有意义的模式或趋势。让我们来看一个更复杂的例子,其中散点沿着一个螺旋路径移动:
import numpy as np
import matplotlib.pyplot as plt
from matplotlib.animation import FuncAnimation

# 创建初始数据
t = np.linspace(0, 2*np.pi, 50)
x = np.cos(t)
y = np.sin(t)

# 创建图表和散点
fig, ax = plt.subplots()
scatter = ax.scatter(x, y)

# 设置图表范围
ax.set_xlim(-1.5, 1.5)
ax.set_ylim(-1.5, 1.5)

# 定义更新函数
def update(frame):
    # 更新数据
    r = frame / 100  # 随时间增加半径
    x = r * np.cos(t + frame/10)
    y = r * np.sin(t + frame/10)
    scatter.set_offsets(np.c_[x, y])
    return scatter,

# 创建动画
ani = FuncAnimation(fig, update, frames=200, interval=50, blit=True)

plt.title("How2matplotlib.com - Spiral Animated Scatter")
plt.show()
Output:
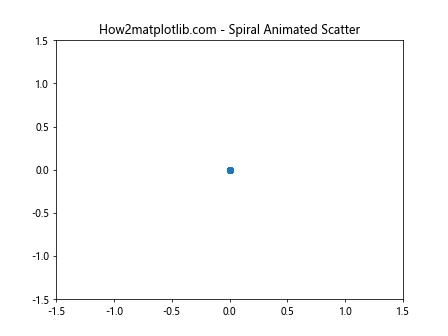
在这个例子中,散点沿着一个不断扩大的螺旋路径移动。我们通过调整半径r和角度来实现这种效果。这种动画可以用来展示周期性数据或者时间序列数据。
3. 添加颜色变化
除了位置的变化,我们还可以通过改变散点的颜色来增加更多的信息维度。下面是一个例子,展示了如何根据散点的位置来动态改变其颜色:
import numpy as np
import matplotlib.pyplot as plt
from matplotlib.animation import FuncAnimation

# 创建初始数据
x = np.random.rand(50)
y = np.random.rand(50)
colors = np.random.rand(50)

# 创建图表和散点
fig, ax = plt.subplots()
scatter = ax.scatter(x, y, c=colors, cmap='viridis')

# 添加颜色条
plt.colorbar(scatter)

# 定义更新函数
def update(frame):
    # 更新数据
    x += 0.1 * (np.random.rand(50) - 0.5)
    y += 0.1 * (np.random.rand(50) - 0.5)
    colors = np.sqrt(x**2 + y**2)
    scatter.set_offsets(np.c_[x, y])
    scatter.set_array(colors)
    return scatter,

# 创建动画
ani = FuncAnimation(fig, update, frames=200, interval=50, blit=True)

plt.title("How2matplotlib.com - Color Changing Animated Scatter")
plt.show()
在这个例子中,散点的颜色根据它们到原点的距离而变化。这种技术可以用来展示多维数据,其中颜色代表了除x和y之外的第三个维度。
4. 添加轨迹
有时,我们可能想要显示散点的移动轨迹。这可以通过在每一帧都绘制新的点,而不是移动现有的点来实现:
import numpy as np
import matplotlib.pyplot as plt
from matplotlib.animation import FuncAnimation

# 创建初始数据
x = [0]
y = [0]

# 创建图表和散点
fig, ax = plt.subplots()
line, = ax.plot(x, y)

# 设置图表范围
ax.set_xlim(-10, 10)
ax.set_ylim(-10, 10)

# 定义更新函数
def update(frame):
    # 添加新的数据点
    x.append(x[-1] + np.random.randn())
    y.append(y[-1] + np.random.randn())
    line.set_data(x, y)
    return line,

# 创建动画
ani = FuncAnimation(fig, update, frames=200, interval=50, blit=True)

plt.title("How2matplotlib.com - Scatter with Trail")
plt.show()
Output:
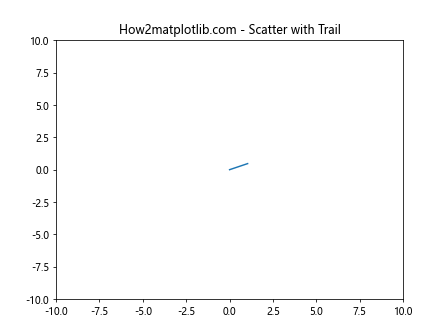
这个例子展示了一个随机游走的过程,每一步都留下轨迹。这种技术可以用来展示时间序列数据或者粒子的运动轨迹。
5. 多组散点的动画
在某些情况下,我们可能需要同时展示多组散点的动画。这可以通过创建多个散点对象并在更新函数中同时更新它们来实现:
import numpy as np
import matplotlib.pyplot as plt
from matplotlib.animation import FuncAnimation

# 创建初始数据
x1 = np.random.rand(20)
y1 = np.random.rand(20)
x2 = np.random.rand(20) + 1
y2 = np.random.rand(20) + 1

# 创建图表和散点
fig, ax = plt.subplots()
scatter1 = ax.scatter(x1, y1, c='red', label='Group 1')
scatter2 = ax.scatter(x2, y2, c='blue', label='Group 2')

ax.legend()

# 定义更新函数
def update(frame):
    # 更新数据
    x1 = np.random.rand(20)
    y1 = np.random.rand(20)
    x2 = np.random.rand(20) + 1
    y2 = np.random.rand(20) + 1
    scatter1.set_offsets(np.c_[x1, y1])
    scatter2.set_offsets(np.c_[x2, y2])
    return scatter1, scatter2

# 创建动画
ani = FuncAnimation(fig, update, frames=200, interval=50, blit=True)

plt.title("How2matplotlib.com - Multiple Group Animated Scatter")
plt.show()
Output:
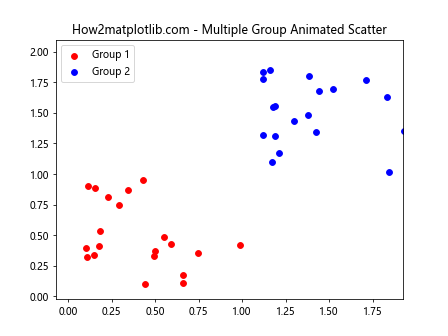
这个例子展示了两组散点的动画。这种技术可以用来比较不同组或类别的数据,或者展示多个数据集的演变过程。
6. 添加文本标签
有时,我们可能想要为散点添加文本标签,以提供更多信息。以下是一个例子,展示了如何为移动的散点添加动态更新的文本标签:
import numpy as np
import matplotlib.pyplot as plt
from matplotlib.animation import FuncAnimation

# 创建初始数据
x = np.random.rand(5)
y = np.random.rand(5)
labels = ['A', 'B', 'C', 'D', 'E']

# 创建图表、散点和文本
fig, ax = plt.subplots()
scatter = ax.scatter(x, y)
texts = [ax.text(x[i], y[i], labels[i]) for i in range(len(labels))]

# 定义更新函数
def update(frame):
    # 更新数据
    x = np.random.rand(5)
    y = np.random.rand(5)
    scatter.set_offsets(np.c_[x, y])
    for i, txt in enumerate(texts):
        txt.set_position((x[i], y[i]))
    return scatter, *texts

# 创建动画
ani = FuncAnimation(fig, update, frames=200, interval=50, blit=True)

plt.title("How2matplotlib.com - Labeled Animated Scatter")
plt.show()
Output:
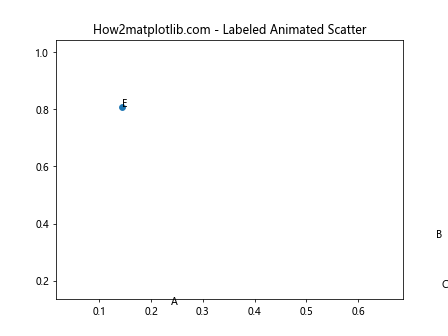
在这个例子中,我们为每个散点添加了一个文本标签。随着散点的移动,标签也会跟随移动。这种技术可以用来标识特定的数据点或者提供额外的信息。
7. 3D动画散点图
Matplotlib也支持创建3D动画散点图。这可以用来展示三维空间中的数据变化。以下是一个简单的3D动画散点图例子:
import numpy as np
import matplotlib.pyplot as plt
from mpl_toolkits.mplot3d import Axes3D
from matplotlib.animation import FuncAnimation

# 创建初始数据
n = 100
x = np.random.rand(n)
y = np.random.rand(n)
z = np.random.rand(n)

# 创建3D图表和散点
fig = plt.figure()
ax = fig.add_subplot(111, projection='3d')
scatter = ax.scatter(x, y, z)

# 定义更新函数
def update(frame):
    # 更新数据
    x = np.random.rand(n)
    y = np.random.rand(n)
    z = np.random.rand(n)
    scatter._offsets3d = (x, y, z)
    return scatter,

# 创建动画
ani = FuncAnimation(fig, update, frames=200, interval=50, blit=False)

plt.title("How2matplotlib.com - 3D Animated Scatter")
plt.show()
Output:
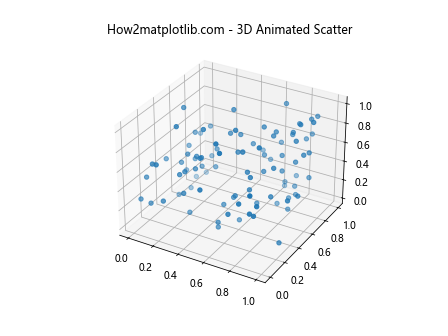
这个例子展示了如何创建一个简单的3D动画散点图。散点在三维空间中随机移动。这种技术可以用来展示复杂的三维数据集或者模拟粒子在三维空间中的运动。
8. 自定义动画控制
Matplotlib允许我们为动画添加自定义控制,比如暂停、继续或重启动画。以下是一个添加了简单控制按钮的动画散点图例子:
import numpy as np
import matplotlib.pyplot as plt
from matplotlib.animation import FuncAnimation
from matplotlib.widgets import Button

# 创建初始数据
x = np.random.rand(20)
y = np.random.rand(20)

# 创建图表和散点
fig, ax = plt.subplots()
scatter = ax.scatter(x, y)

# 创建动画对象
ani = None

# 定义更新函数
def update(frame):
    # 更新数据
    x = np.random.rand(20)
    y = np.random.rand(20)
    scatter.set_offsets(np.c_[x, y])
    return scatter,

# 定义开始动画的函数
def start_animation(event):
    global ani
    ani = FuncAnimation(fig, update, frames=200, interval=50, blit=True)

# 定义停止动画的函数
def stop_animation(event):
    global ani
    if ani is not None:
        ani.event_source.stop()

# 添加按钮
ax_start = plt.axes([0.81, 0.05, 0.1, 0.075])
ax_stop = plt.axes([0.7, 0.05, 0.1, 0.075])
btn_start = Button(ax_start, 'Start')
btn_stop = Button(ax_stop, 'Stop')
btn_start.on_clicked(start_animation)
btn_stop.on_clicked(stop_animation)

plt.title("How2matplotlib.com - Controlled Animated Scatter")
plt.show()
Output:
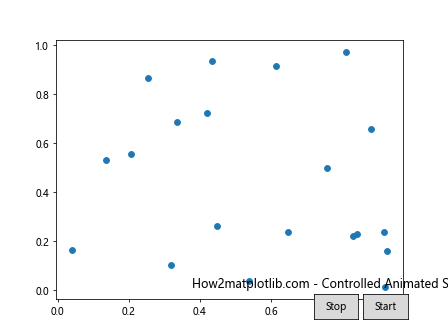
在这个例子中,我们添加了”开始”和”停止”按钮来控制动画的播放。这种技术可以让用户更好地控制动画的播放过程,特别是在分析复杂数据时非常有用。
9. 保存动画
有时,我们可能想要保存创建的动画以便later查看或分享。Matplotlib提供了多种方式来保存动画,包括保存为GIF或视频文件。以下是一个保存动画为GIF的例子:
import numpy as np
import matplotlib.pyplot as plt
from matplotlib.animation import FuncAnimation, PillowWriter

# 创建初始数据
x = np.random.rand(20)
y = np.random.rand(20)

# 创建图表和散点
fig, ax = plt.subplots()
scatter = ax.scatter(x, y)

# 定义更新函数
def update(frame):
    # 更新数据
    x = np.random.rand(20)
    y = np.random.rand(20)scatter.set_offsets(np.c_[x, y])
    return scatter,

# 创建动画
ani = FuncAnimation(fig, update, frames=200, interval=50, blit=True)

# 保存动画
writer = PillowWriter(fps=25)
ani.save("how2matplotlib_animated_scatter.gif", writer=writer)

plt.title("How2matplotlib.com - Saved Animated Scatter")
plt.close()
在这个例子中,我们使用PillowWriter将动画保存为GIF文件。这种方法可以让你轻松地分享你的动画,或者将其嵌入到网页或演示文稿中。
10. 数据驱动的动画
到目前为止,我们的例子主要使用随机数据。然而,在实际应用中,我们通常会使用真实的数据集来创建动画。以下是一个使用时间序列数据创建动画散点图的例子:
import numpy as np
import matplotlib.pyplot as plt
from matplotlib.animation import FuncAnimation

# 创建模拟的时间序列数据
np.random.seed(0)
t = np.linspace(0, 10, 1000)
x = np.sin(t) + np.random.normal(0, 0.1, 1000)
y = np.cos(t) + np.random.normal(0, 0.1, 1000)

# 创建图表和散点
fig, ax = plt.subplots()
scatter = ax.scatter([], [], c=[])

# 设置图表范围
ax.set_xlim(-2, 2)
ax.set_ylim(-2, 2)

# 定义更新函数
def update(frame):
    # 更新数据
    scatter.set_offsets(np.c_[x[:frame], y[:frame]])
    scatter.set_array(t[:frame])
    return scatter,

# 创建动画
ani = FuncAnimation(fig, update, frames=len(t), interval=20, blit=True)

plt.title("How2matplotlib.com - Time Series Animated Scatter")
plt.colorbar(scatter)
plt.show()
Output:
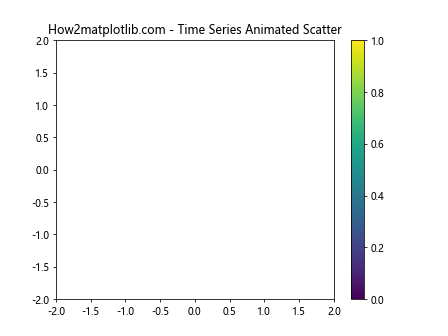
这个例子展示了如何使用时间序列数据创建动画散点图。散点的颜色随时间变化,这可以用来展示数据的时间维度。这种技术特别适合展示随时间变化的数据,如股票价格、气象数据或科学实验结果。
11. 交互式动画散点图
Matplotlib还支持创建交互式的动画散点图。通过添加滑块或其他控件,用户可以实时调整动画参数。以下是一个使用滑块控制动画速度的例子:
import numpy as np
import matplotlib.pyplot as plt
from matplotlib.animation import FuncAnimation
from matplotlib.widgets import Slider

# 创建初始数据
x = np.random.rand(20)
y = np.random.rand(20)

# 创建图表和散点
fig, ax = plt.subplots()
scatter = ax.scatter(x, y)

# 添加滑块
ax_slider = plt.axes([0.2, 0.02, 0.6, 0.03])
slider = Slider(ax_slider, 'Speed', 10, 200, valinit=50)

# 定义更新函数
def update(frame):
    # 更新数据
    x = np.random.rand(20)
    y = np.random.rand(20)
    scatter.set_offsets(np.c_[x, y])
    return scatter,

# 创建动画
ani = FuncAnimation(fig, update, frames=200, interval=50, blit=True)

# 定义滑块更新函数
def update_speed(val):
    ani.event_source.interval = slider.val

slider.on_changed(update_speed)

plt.title("How2matplotlib.com - Interactive Animated Scatter")
plt.show()
Output:
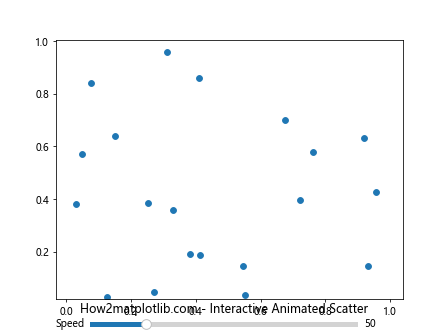
在这个例子中,我们添加了一个滑块来控制动画的速度。用户可以实时调整动画的播放速度,这对于分析不同时间尺度的数据非常有用。
12. 动画散点图中的数据聚类
动画散点图也可以用来展示数据聚类的过程。以下是一个简单的K-means聚类动画的例子:
import numpy as np
import matplotlib.pyplot as plt
from matplotlib.animation import FuncAnimation
from sklearn.cluster import KMeans

# 创建初始数据
np.random.seed(0)
X = np.random.rand(100, 2)

# 创建图表和散点
fig, ax = plt.subplots()
scatter = ax.scatter(X[:, 0], X[:, 1])

# 定义更新函数
def update(frame):
    # 执行K-means聚类
    kmeans = KMeans(n_clusters=frame+1, random_state=0)
    labels = kmeans.fit_predict(X)

    # 更新散点颜色
    scatter.set_array(labels)
    return scatter,

# 创建动画
ani = FuncAnimation(fig, update, frames=5, interval=1000, blit=True)

plt.title("How2matplotlib.com - K-means Clustering Animation")
plt.colorbar(scatter)
plt.show()
Output:
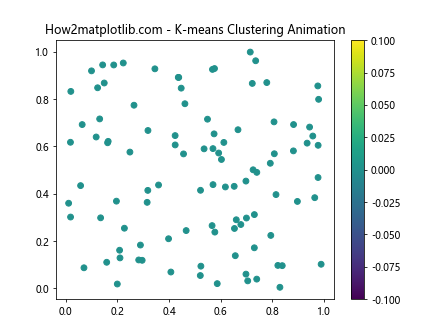
这个例子展示了K-means聚类算法的过程。随着聚类数量的增加,散点的颜色会发生变化,反映了它们所属的聚类。这种动画可以帮助理解聚类算法的工作原理,以及数据如何被分组。
13. 动画散点图中的数据流
在某些应用中,我们可能需要展示实时数据流。以下是一个模拟实时数据流的动画散点图例子:
import numpy as np
import matplotlib.pyplot as plt
from matplotlib.animation import FuncAnimation
from collections import deque

# 创建初始数据
max_points = 100
data = deque(maxlen=max_points)

# 创建图表和散点
fig, ax = plt.subplots()
scatter = ax.scatter([], [])

# 设置图表范围
ax.set_xlim(0, max_points)
ax.set_ylim(-1, 1)

# 定义更新函数
def update(frame):
    # 添加新数据点
    data.append((frame, np.sin(frame * 0.1)))

    # 更新散点
    scatter.set_offsets(data)
    return scatter,

# 创建动画
ani = FuncAnimation(fig, update, frames=200, interval=50, blit=True)

plt.title("How2matplotlib.com - Data Stream Animation")
plt.show()
Output:
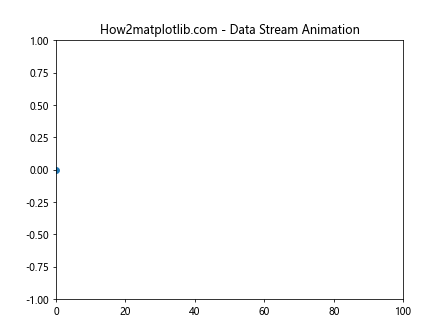
这个例子模拟了一个实时数据流,新的数据点不断被添加,而旧的数据点被移除。这种技术可以用于展示传感器数据、股票价格或其他实时更新的数据源。
14. 动画散点图中的粒子系统
动画散点图还可以用来模拟粒子系统。以下是一个简单的粒子系统动画例子:
import numpy as np
import matplotlib.pyplot as plt
from matplotlib.animation import FuncAnimation

# 初始化粒子
n_particles = 50
particles = np.random.randn(n_particles, 2)
velocities = np.random.randn(n_particles, 2) * 0.1

# 创建图表和散点
fig, ax = plt.subplots()
scatter = ax.scatter(particles[:, 0], particles[:, 1])

# 设置图表范围
ax.set_xlim(-5, 5)
ax.set_ylim(-5, 5)

# 定义更新函数
def update(frame):
    global particles, velocities

    # 更新粒子位置
    particles += velocities

    # 边界检查
    out_of_bounds = np.abs(particles) > 5
    velocities[out_of_bounds] *= -1

    # 更新散点位置
    scatter.set_offsets(particles)
    return scatter,

# 创建动画
ani = FuncAnimation(fig, update, frames=200, interval=50, blit=True)

plt.title("How2matplotlib.com - Particle System Animation")
plt.show()
Output:
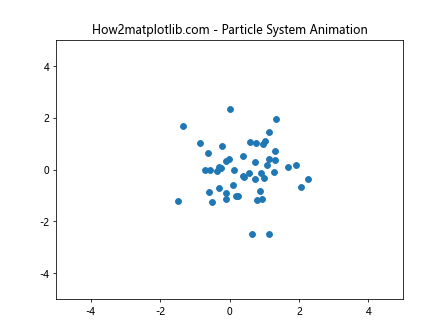
这个例子模拟了一个简单的粒子系统,粒子在边界内移动并反弹。这种技术可以用于模拟物理系统、群体行为或其他动态系统。
15. 结合其他图表元素
动画散点图可以与其他Matplotlib图表元素结合,创造出更丰富的可视化效果。以下是一个结合等高线图的动画散点图例子:
import numpy as np
import matplotlib.pyplot as plt
from matplotlib.animation import FuncAnimation

# 创建网格数据
x = np.linspace(-5, 5, 100)
y = np.linspace(-5, 5, 100)
X, Y = np.meshgrid(x, y)
Z = np.sin(np.sqrt(X**2 + Y**2))

# 创建初始散点数据
n_points = 20
scatter_x = np.random.uniform(-5, 5, n_points)
scatter_y = np.random.uniform(-5, 5, n_points)

# 创建图表
fig, ax = plt.subplots()

# 绘制等高线图
contour = ax.contourf(X, Y, Z, cmap='viridis')
plt.colorbar(contour)

# 创建散点
scatter = ax.scatter(scatter_x, scatter_y, c='red', s=50)

# 定义更新函数
def update(frame):
    # 更新散点位置
    scatter_x = np.random.uniform(-5, 5, n_points)
    scatter_y = np.random.uniform(-5, 5, n_points)
    scatter.set_offsets(np.c_[scatter_x, scatter_y])
    return scatter,

# 创建动画
ani = FuncAnimation(fig, update, frames=200, interval=50, blit=True)

plt.title("How2matplotlib.com - Animated Scatter with Contour")
plt.show()
Output:
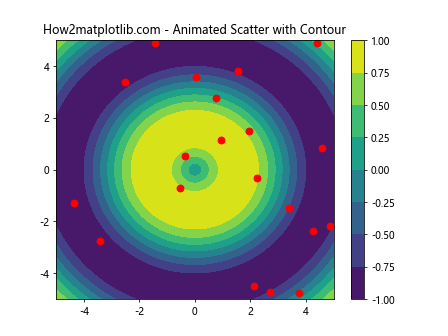
这个例子展示了如何将动画散点图与静态等高线图结合。散点在等高线图上移动,这可以用来展示粒子在某个场中的运动,或者数据点在某个分布上的采样过程。
结论
动画散点图是Matplotlib中一个强大而灵活的可视化工具。通过本文的详细介绍和多个示例,我们探索了创建动画散点图的各种技术和应用场景。从基本的随机移动到复杂的数据驱动动画,从2D到3D,从单一散点到多组散点,我们看到了动画散点图的多样性和适应性。
动画散点图不仅能够展示数据的静态特征,还能揭示数据的动态变化过程。它们特别适合用于展示时间序列数据、模拟物理系统、可视化算法过程、展示数据流等场景。通过添加交互式控件,我们还可以让用户更好地控制和探索数据。
在实际应用中,动画散点图可以帮助我们发现数据中的模式和趋势,理解复杂系统的行为,或者简单地创造出吸引人的数据可视化效果。无论是用于科学研究、数据分析还是数据展示,掌握动画散点图的创建技巧都将极大地丰富你的数据可视化工具箱。
最后,值得注意的是,虽然动画散点图功能强大,但在使用时也要注意控制复杂度,确保动画的流畅性和可解释性。同时,根据具体的应用场景和目标受众来选择合适的动画效果和交互方式也很重要。通过不断的实践和探索,你将能够创造出既美观又有洞察力的动画散点图。
 极客教程
极客教程