Matplotlib添加图例

在使用matplotlib绘制图表时,添加图例是非常重要的,可以帮助读者更好地理解图表内容。本文将详细介绍如何在matplotlib中添加图例,包括在不同类型的图表中添加图例,以及如何自定义图例的位置、大小和样式。
1. 在折线图中添加图例
在折线图中添加图例是最常见的需求之一。我们可以使用plt.legend()函数来添加图例,该函数会根据每条折线的label属性自动创建图例。
import matplotlib.pyplot as plt

x = [1, 2, 3, 4, 5]
y1 = [2, 3, 5, 7, 11]
y2 = [1, 4, 9, 16, 25]

plt.plot(x, y1, label='y = x^2')
plt.plot(x, y2, label='y = x^3')

plt.legend()
plt.show()
代码运行结果:

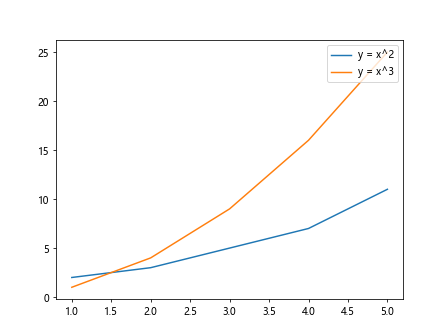
在上面的示例中,我们分别绘制了两条折线,并为每条折线指定了label属性,然后调用plt.legend()函数即可添加图例。
2. 自定义图例的位置
有时候默认的图例位置并不理想,我们可以使用loc参数来指定图例的位置。常用的位置包括’upper left’、’upper right’、’lower left’、’lower right’等。
import matplotlib.pyplot as plt

x = [1, 2, 3, 4, 5]
y1 = [2, 3, 5, 7, 11]
y2 = [1, 4, 9, 16, 25]

plt.plot(x, y1, label='y = x^2')
plt.plot(x, y2, label='y = x^3')

plt.legend(loc='upper right')
plt.show()
代码运行结果:
3. 自定义图例的大小和样式
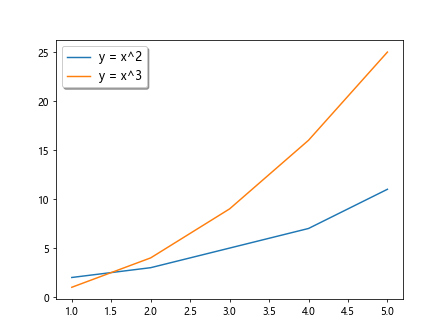
我们还可以通过fontsize参数来调整图例的字体大小,通过shadow参数来添加阴影效果。
import matplotlib.pyplot as plt

x = [1, 2, 3, 4, 5]
y1 = [2, 3, 5, 7, 11]
y2 = [1, 4, 9, 16, 25]

plt.plot(x, y1, label='y = x^2')
plt.plot(x, y2, label='y = x^3')

plt.legend(fontsize='large', shadow=True)
plt.show()
代码运行结果:
4. 在散点图中添加图例
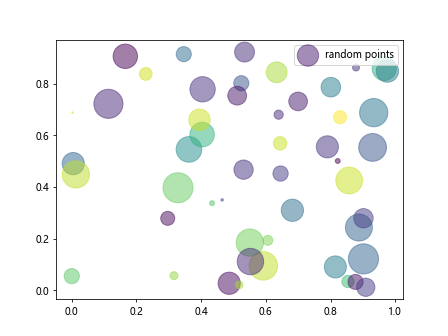
在散点图中添加图例也是非常常见的需求。我们可以使用plt.scatter()函数来绘制散点图,并通过label属性来添加图例。
import numpy as np
import matplotlib.pyplot as plt

x = np.random.rand(50)
y = np.random.rand(50)
colors = np.random.rand(50)
sizes = 1000 * np.random.rand(50)

plt.scatter(x, y, c=colors, s=sizes, alpha=0.5, label='random points')

plt.legend()
plt.show()
代码运行结果:
5. 在柱状图中添加图例
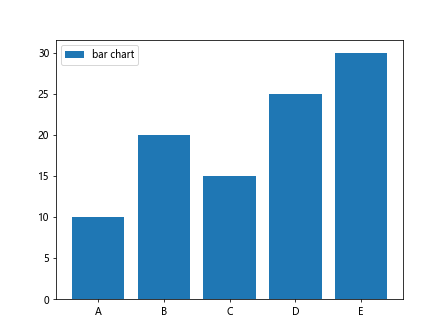
在柱状图中添加图例也是非常简单的。我们可以使用plt.bar()函数来绘制柱状图,并通过label属性来添加图例。
import matplotlib.pyplot as plt

x = ['A', 'B', 'C', 'D', 'E']
y = [10, 20, 15, 25, 30]

plt.bar(x, y, label='bar chart')

plt.legend()
plt.show()
代码运行结果:
6. 在饼图中添加图例
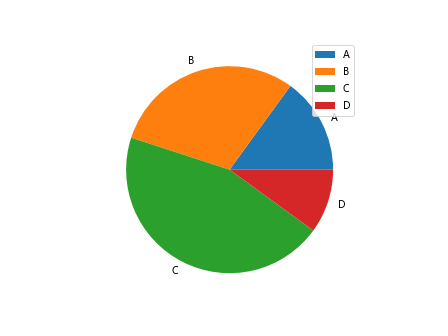
在饼图中添加图例也是非常简单的。我们可以使用plt.pie()函数来绘制饼图,并通过labels参数来添加图例。
import matplotlib.pyplot as plt

sizes = [15, 30, 45, 10]
labels = ['A', 'B', 'C', 'D']

plt.pie(sizes, labels=labels)

plt.legend()
plt.show()
代码运行结果:
7. 自定义图例的标题
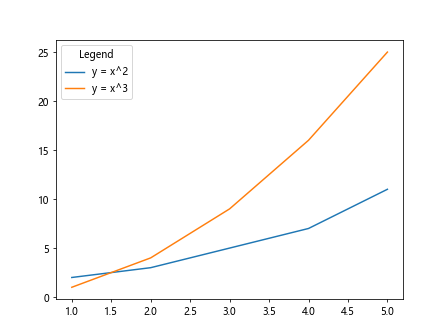
有时候我们需要为图例添加标题,可以使用title参数来指定图例的标题。
import matplotlib.pyplot as plt

x = [1, 2, 3, 4, 5]
y1 = [2, 3, 5, 7, 11]
y2 = [1, 4, 9, 16, 25]

plt.plot(x, y1, label='y = x^2')
plt.plot(x, y2, label='y = x^3')

plt.legend(title='Legend')
plt.show()
代码运行结果:
8. 在多个子图中添加图例
在多个子图中添加图例也是非常常见的需求。我们可以使用plt.subplots()函数创建多个子图,并为每个子图添加图例。
import matplotlib.pyplot as plt

fig, axs = plt.subplots(2)

axs[0].plot(x, y1, label='y = x^2')
axs[1].plot(x, y2, label='y = x^3')

axs[0].legend()
axs[1].legend()

plt.show()
9. 自定义图例的边框
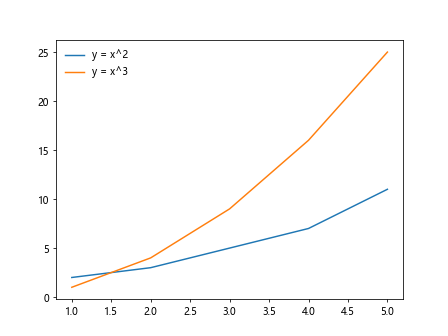
我们还可以通过frameon参数来控制图例的边框是否显示。
import matplotlib.pyplot as plt

x = [1, 2, 3, 4, 5]
y1 = [2, 3, 5, 7, 11]
y2 = [1, 4, 9, 16, 25]

plt.plot(x, y1, label='y = x^2')
plt.plot(x, y2, label='y = x^3')

plt.legend(frameon=False)
plt.show()
代码运行结果:
10. 在3D图中添加图例
在3D图中添加图例也是非常简单的。我们可以使用Axes3D对象的plot_surface()函数来绘制3D图,并通过label属性来添加图例。
from mpl_toolkits.mplot3d import Axes3D
import matplotlib.pyplot as plt

fig = plt.figure()
ax = fig.add_subplot(111, projection='3d')

x = np.linspace(-5, 5, 100)
y = np.linspace(-5, 5, 100)
X, Y = np.meshgrid(x, y)
Z = np.sin(np.sqrt(X**2 + Y**2))

surf = ax.plot_surface(X, Y, Z, label='3D surface')

plt.legend()
plt.show()
 极客教程
极客教程