Python numpy.linspace()
Python numpy.linspace()函数返回数字空格均匀W.R.T间隔。类似于numpy.arange()函数,但它使用的不是step,而是sample number。
语法 :
numpy.linspace(start,
               stop,
               num = 50,
               endpoint = True,
               retstep = False,
               dtype = None)
参数 :
start : [可选]区间范围的开始。默认情况下,start = 0
stop :间隔范围的结束。
restep : 如果为真,返回(样本,步骤)。默认情况下,restep = False
num : [int, optional] 要生成的样本数。
dtype : 输出数组的类型
返回 :
ndarray
step : [float, optional], if restep = True
代码1:解释linspace函数
# Python Programming illustrating
# numpy.linspace method

import numpy as geek

# restep set to True
print("B\n", geek.linspace(2.0, 3.0, num=5, retstep=True), "\n")

# To evaluate sin() in long range
x = geek.linspace(0, 2, 10)
print("A\n", geek.sin(x))
输出 :
B
 (array([ 2.  ,  2.25,  2.5 ,  2.75,  3.  ]), 0.25)

A
 [ 0.          0.22039774  0.42995636  0.6183698   0.77637192  0.8961922
  0.9719379   0.99988386  0.9786557   0.90929743]
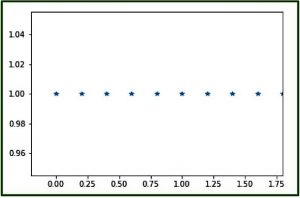
代码2:使用matplotlib模块pylab图形表示numpy.linspace()
# Graphical Representation of numpy.linspace()
import numpy as geek
import pylab as p

# Start = 0
# End = 2
# Samples to generate = 10
x1 = geek.linspace(0, 2, 10, endpoint = False)
y1 = geek.ones(10)

p.plot(x1, y1, '*')
p.xlim(-0.2, 1.8)
输出 :

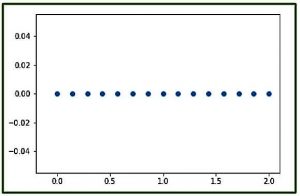
代码3:使用pylab图形表示numpy.linspace()
# Graphical Representation of numpy.linspace()
import numpy as geek
import pylab as p

# Start = 0
# End = 2
# Samples to generate = 15
x1 = geek.linspace(0, 2, 15, endpoint = True)
y1 = geek.zeros(15)

p.plot(x1, y1, 'o')
p.xlim(-0.2, 2.1)
输出 :

 极客教程
极客教程