如何使用ChartJS实现堆叠线图
在本文中,我们将学习如何使用Chart JS插件实现普通和网格堆叠线图。
在我们通常需要分析具有不同测量单位的数据的情况下,堆叠线图能够帮助我们轻松识别和比较数据中的趋势和模式。
堆叠线图通过将线条堆叠在一起来显示对数据趋势的贡献。数据通常按照从低到高的模式进行排序。当我们有多个数据集总和为总趋势时,我们使用这种类型的图表。
堆叠线图的用途:
- 我们可以快速比较两组(数据)测量值。
- 当数据堆叠在一起时,我们可以更清楚地看到数据点。
- 我们可以轻松跟踪多个数据趋势。
- 我们可以快速查看每个数据点相对于总值的百分比。
实现方法:
-
在HTML设计中,使用
<canvas>标记显示折线图。 - 在代码的script部分中,通过设置库的type、data和options属性来实例化ChartJS对象。
-
根据程序员的需求,在每个属性中设置其他必需的选项,如datasets、label、backgroundColor、scales和其他选项。
CDN链接:
<script src=”https://ajax.googleapis.com/ajax/libs/jquery/3.6.1/jquery.min.js”></script>
<script src=”https://cdnjs.cloudflare.com/ajax/libs/Chart.js/4.1.2/chart.umd.js”></script>
语法:
new Chart($("#ID"), {
    type: 'line',
    data: { ... },
    options: { ... }
});
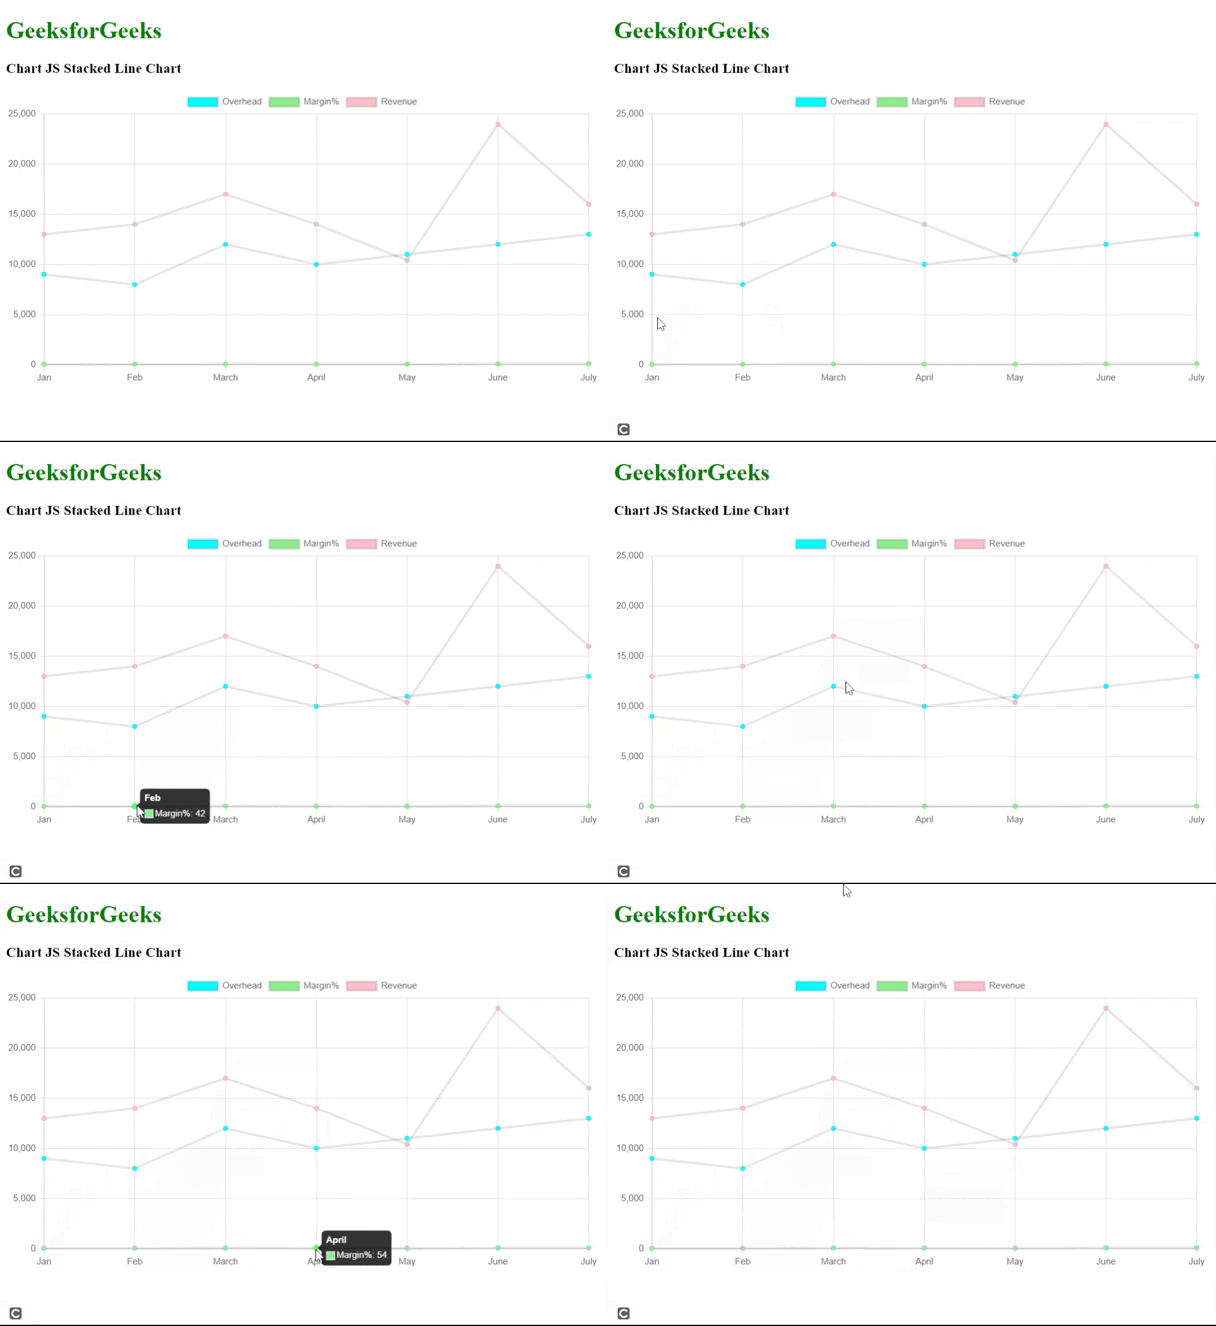
示例 1: 下面的代码演示了堆叠折线图的一个非常简单的示例,使用不同的计量单位,如“收入”,“利润率%”和“运营开销”,并在一段时间内进行测量(底部表示月份)。
HTML
<!DOCTYPE html>
<html>

<head>
    <title>Chart JS Stacked line Chart </title>
    <script src=
"https://ajax.googleapis.com/ajax/libs/jquery/3.6.1/jquery.min.js">
    </script>
    <script src=
"https://cdn.jsdelivr.net/npm/chart.js@4.0.1/dist/chart.umd.min.js">
    </script>
</head>

<body>
    <div id="containerID">
        <h1 style="color:green">GeeksforGeeks</h1>
        <h3>Chart JS Stacked Line Chart </h3>
        <div>
            <canvas id="stackedLineChartID">
            </canvas>
        </div>
    </div>

    <script>
        // Get the drawing context on the canvas
        var myContext = document.getElementById("stackedLineChartID");
        var myChart = new Chart(myContext, {
            type: 'line',
            data: {
                labels: ["Jan", "Feb", "March", "April", "May", "June","July"],
                datasets: [{
                    label: 'Overhead',
                    backgroundColor: "cyan",
                    data: [9000, 8000,12000,10000,11000,12000,13000],
                    fill:false
                }, {
                    label: 'Margin%',
                    backgroundColor: "lightgreen",
                    data: [31, 42, 64,54, 41,75,81],
                    fill:false
                }, {
                    label: 'Revenue',
                    backgroundColor: "pink",
                    data: [13000, 14000,17000,14000,10400,24000,16000],
                    fill:false
                }],
            },
            options: {
                responsive: true
            }
        });
    </script>
</body>
</html>
输出:

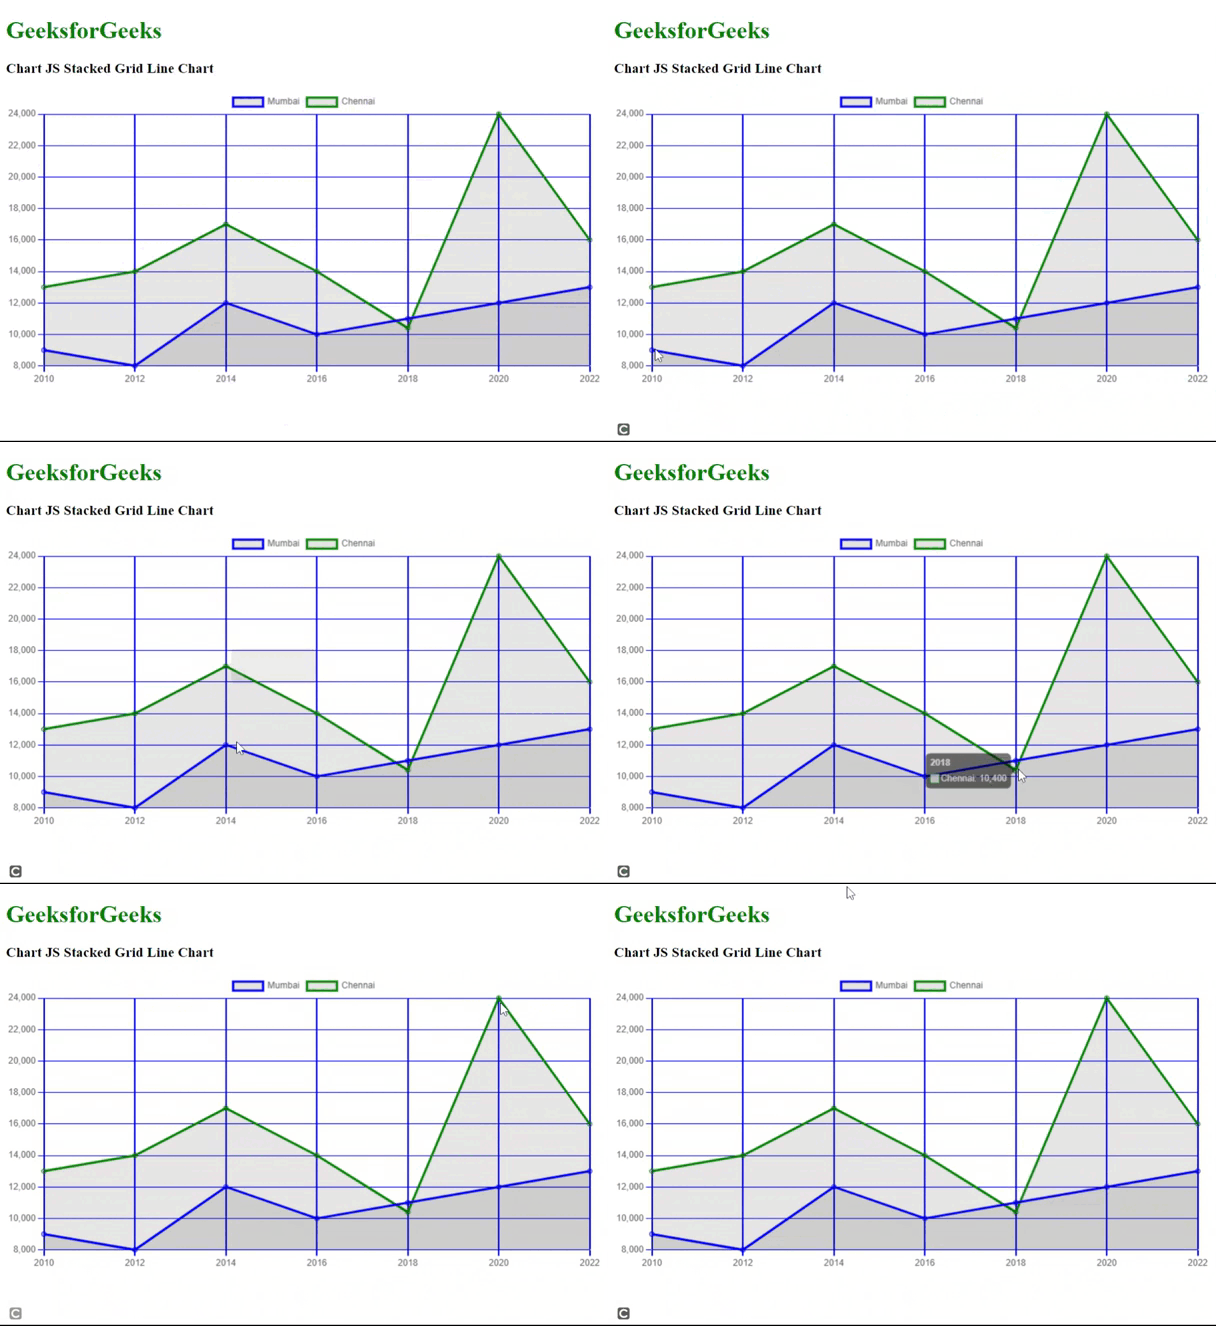
示例2: 以下代码演示了网格堆叠线图。选项 ****属性被设置为绘制x轴和y轴上的网格。图表底部显示了一个简单的示例,考虑了孟买和钦奈的人口随时间变化的情况(在图表底部的年份)。请参考输出以获得更好的理解。
HTML
<!DOCTYPE html>
<html>

<head>
    <title>Chart JS Stacked line Chart </title>
    <script src=
"https://ajax.googleapis.com/ajax/libs/jquery/3.6.1/jquery.min.js">
    </script>
    <script src=
"https://cdn.jsdelivr.net/npm/chart.js@4.0.1/dist/chart.umd.min.js">
    </script>
</head>

<body>
    <div id="containerID">
        <h1 style="color:green">GeeksforGeeks</h1>
        <h3>Chart JS Stacked Grid Line Chart </h3>
        <div>
            <canvas id="stackedLineChartID">
            </canvas>
        </div>
    </div>

    <script>
        // Get the drawing context on the canvas
        var myContext = document.getElementById("stackedLineChartID");
        var myChart = new Chart(myContext, {
            type: 'line',
            data: {
                labels: ["2010", "2012", "2014",
                    "2016", "2018", "2020","2022"],
                datasets: [{
                    label: 'Mumbai',
                    borderColor: "blue",
                    data: [9000, 8000,12000,10000,11000,12000,13000],
                    fill:true
                },  {
                    label: 'Chennai',
                    borderColor: "green",
                    data: [13000, 14000,17000,14000,10400,24000,16000],
                    fill:true
                }],
            },
            options: {
                responsive: true,
                title:
                    {
                        display: true,
                        text: 'Chart JS Gridlines - Line Chart'
                    },
                    scales: {
                        x: {
                            grid : {
                                display : true,
                                color: "blue",
                                lineWidth: 2
                            }
                        },
                        y : {
                            grid : {
                                display : true,
                                color: "blue"
                            }
                        }
                    }//end scales
            }//end options
        });
    </script>
</body>
</html>
输出:

 极客教程
极客教程