如何使用ChartJS实现堆叠条形图
在本文中,我们将学习使用JavaScript Chart JS插件实现几个堆叠条形图。堆叠条形图是一系列列或条形图叠放在一起,显示了一些变量的比较和组成。这些变化非常容易看到。它主要用于比较一些数据,比较分类变量的数值。
语法:
new Chart($("#ID"), {
    type: 'bar',
    data: { ... },
    options: { ... }
});
CDN链接:
<script src=”https://ajax.googleapis.com/ajax/libs/jquery/3.6.1/jquery.min.js”> </script>
<script src=”https://cdn.jsdelivr.net/npm/chart.js@4.0.1/dist/chart.umd.min.js”> </script>
方法:
- 在HTML设计中,使用
<canvas>标签来显示条形图或饼图。 - 在代码的 script 部分,通过设置库的 type , data 和 options 属性来实例化ChartJS对象。
- type: type可以取值为ChartJS库中的“pie”,“bar”和“line”。
- data: 它设置包含数据数组和其他相关属性的标签和数据集。
- options: 它设置轴的方向、图表的标题和显示标志作为布尔值true或false。
- 根据程序员的需求,在每个属性内设置其他必需的选项,如 datasets , label , backgroundColor , indexAxis , scales 等。
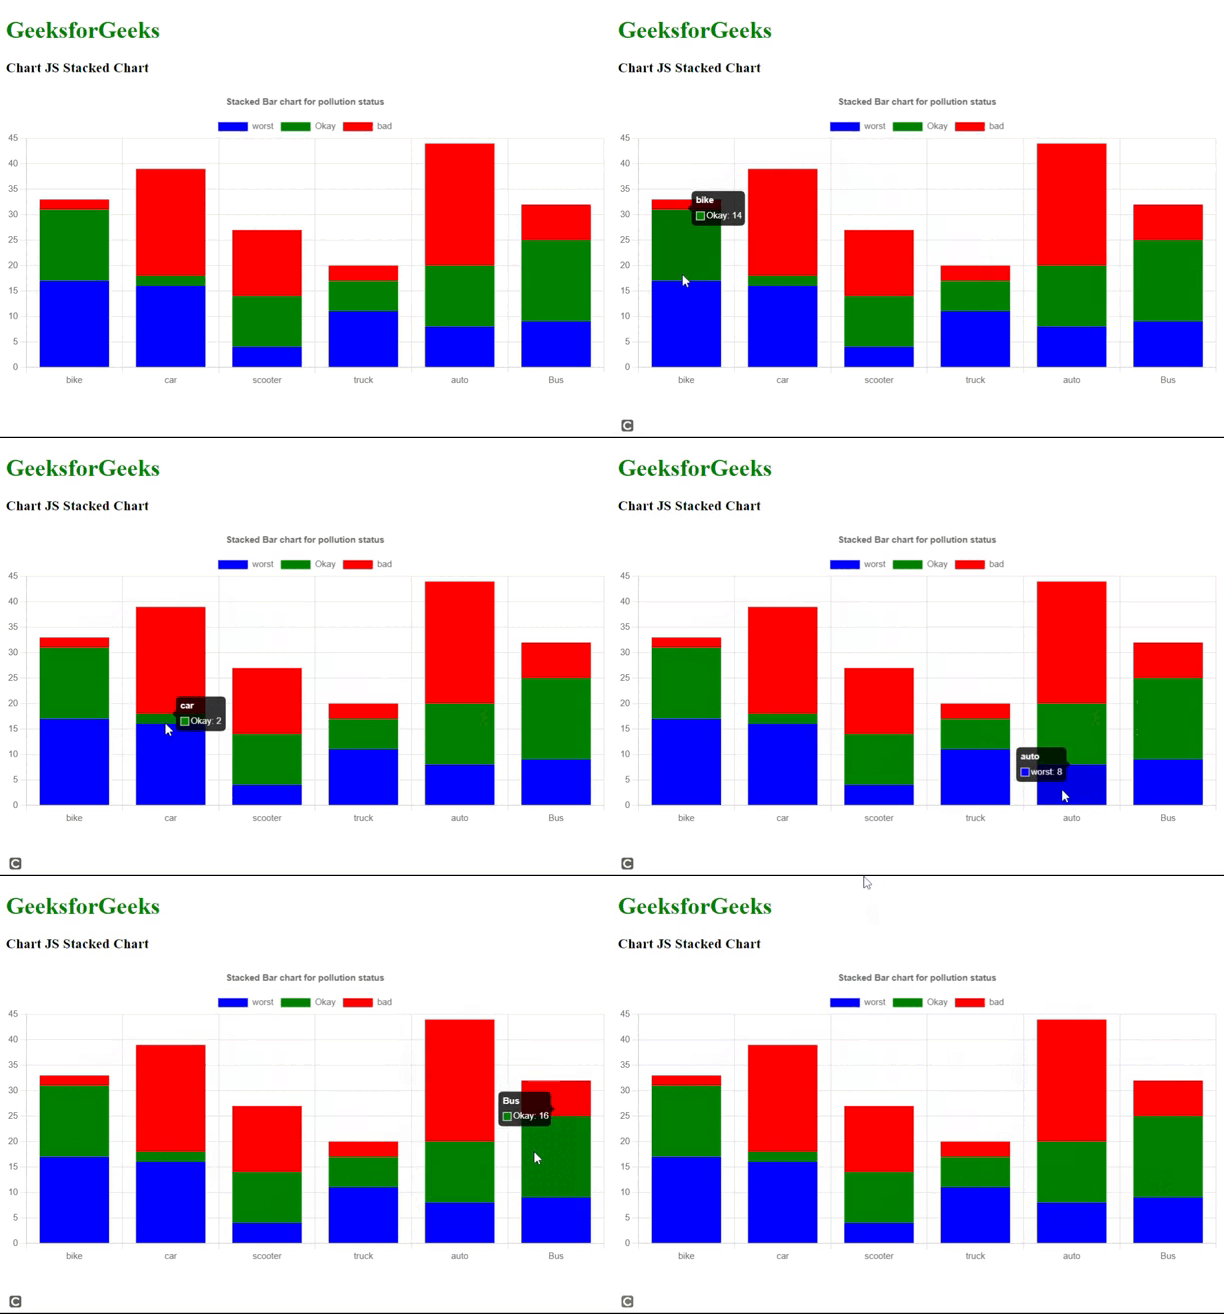
示例1: 以下代码演示了一个简单的堆叠条形图,显示了城市中各种交通工具(自行车、滑板车、汽车和卡车)的污染水平(图表的左侧)。
HTML
<!DOCTYPE html>
<html>

<head>
    <title>ChartJS Stacked Bar Chart Example</title>
    <script src=
"https://ajax.googleapis.com/ajax/libs/jquery/3.6.1/jquery.min.js">
    </script>
    <script src=
"https://cdn.jsdelivr.net/npm/chart.js@4.0.1/dist/chart.umd.min.js">
    </script>
</head>

<body>
    <h1 style="color:green;">
        GeeksforGeeks
    </h1>

    <h3>Chart JS Stacked Chart </h3>

    <div>
        <canvas id="stackedChartID"></canvas>
    </div>


    <script>

        // Get the drawing context on the canvas
        var myContext = document.getElementById(
            "stackedChartID").getContext('2d');
        var myChart = new Chart(myContext, {
            type: 'bar',
            data: {
                labels: ["bike", "car", "scooter",
                    "truck", "auto", "Bus"],
                datasets: [{
                    label: 'worst',
                    backgroundColor: "blue",
                    data: [17, 16, 4, 11, 8, 9],
                }, {
                    label: 'Okay',
                    backgroundColor: "green",
                    data: [14, 2, 10, 6, 12, 16],
                }, {
                    label: 'bad',
                    backgroundColor: "red",
                    data: [2, 21, 13, 3, 24, 7],
                }],
            },
            options: {
                plugins: {
                    title: {
                        display: true,
                        text: 'Stacked Bar chart for pollution status'
                    },
                },
                scales: {
                    x: {
                        stacked: true,
                    },
                    y: {
                        stacked: true
                    }
                }
            }
        });
    </script>
</body>

</html>
输出:

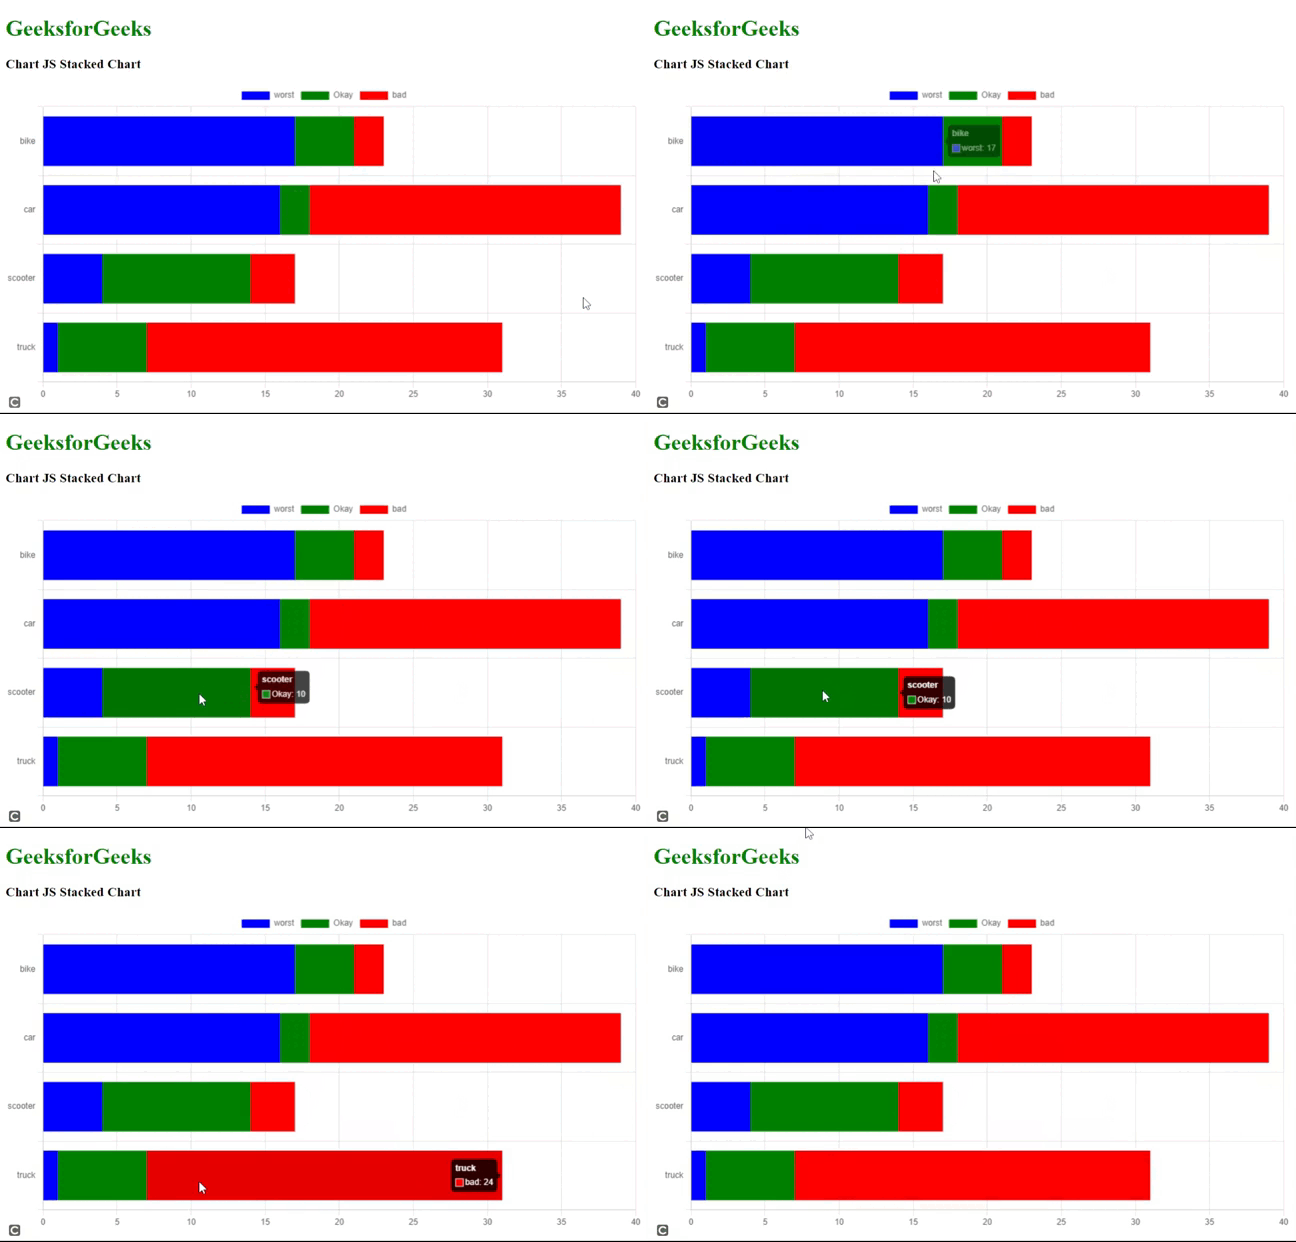
示例2: 下面的代码演示了一个简单的水平堆叠条形图,显示了一个城市中不同交通工具(自行车、摩托车、汽车和卡车)产生的污染水平(图表的底部)。
HTML
<!DOCTYPE html>
<html>

<head>
    <title>ChartJS Stacked Bar Chart Example</title>
    <script src=
"https://ajax.googleapis.com/ajax/libs/jquery/3.6.1/jquery.min.js">
    </script>
    <script src=
"https://cdn.jsdelivr.net/npm/chart.js@4.0.1/dist/chart.umd.min.js">
    </script>
</head>

<body>
    <div id="containerID">
        <h1 style="color:green;">
            GeeksforGeeks
        </h1>

        <h3>Chart JS Stacked Chart </h3>

        <div>
            <canvas id="stackedChartID"></canvas>
        </div>
    </div>

    <script>
        // Get the drawing context on the canvas
        var myContext = document.getElementById(
            "stackedChartID").getContext('2d');

        var myChart = new Chart(myContext, {
            type: 'bar',
            data: {
                labels: ["bike", "car", "scooter", "truck"],
                datasets: [{
                    label: 'worst',
                    backgroundColor: "blue",
                    data: [17, 16, 4, 1],
                }, {
                    label: 'Okay',
                    backgroundColor: "green",
                    data: [4, 2, 10, 6],
                }, {
                    label: 'bad',
                    backgroundColor: "red",
                    data: [2, 21, 3, 24],
                }],
            },
            options: {
                indexAxis: 'y',
                scales: {
                    x: {
                        stacked: true,
                    },
                    y: {
                        stacked: true
                    }
                },
                responsive: true
            }
        });
    </script>
</body>

</html>
输出:

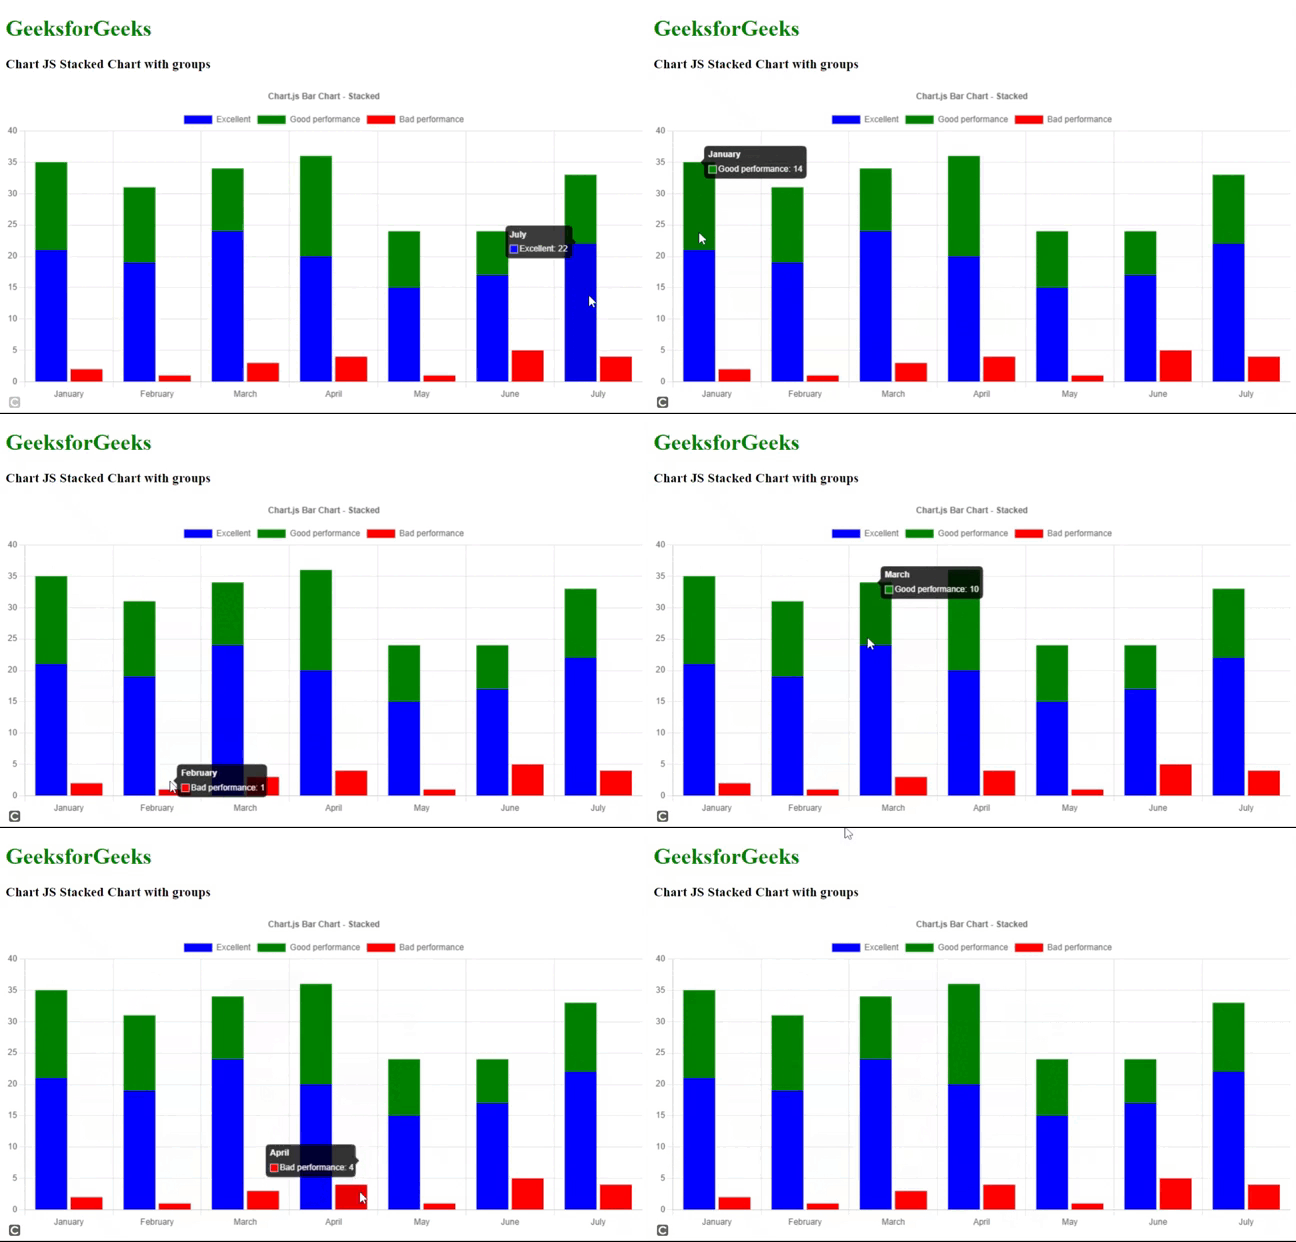
示例3: 以下代码演示了带有分组的堆叠柱状图。堆叠分为不同的组,如下面的代码中的“Stack 0”和“Stack 1”。它显示了不同学生在几个月内底部标记的时间段内的表现,即“好”,“差”和“优秀”。
HTML
<!DOCTYPE html>
<html>

<head>
    <title>ChartJS Stacked Bar Chart Example</title>
    <script src=
"https://ajax.googleapis.com/ajax/libs/jquery/3.6.1/jquery.min.js">
    </script>
    <script src=
"https://cdn.jsdelivr.net/npm/chart.js@4.0.1/dist/chart.umd.min.js">
    </script>
</head>

<body>
    <div id="containerID">
        <h1 style="color:green;">
            GeeksforGeeks
        </h1>

        <h3>Chart JS Stacked Chart with groups </h3>

        <div>
            <canvas id="stackedChartID"></canvas>
        </div>
    </div>

    <script>
        // Get the drawing context on the canvas
        var myContext = document.getElementById(
            "stackedChartID").getContext('2d');

        var myChart = new Chart(myContext, {
            type: 'bar',
            data: {
                labels: ["January", "February", "March",
                    "April", "May", "June", "July"],
                datasets: [{
                    label: 'Excellent',
                    backgroundColor: "blue",
                    data: [21, 19, 24, 20, 15, 17, 22],
                    stack: 'Stack 0',
                }, {
                    label: 'Good performance',
                    backgroundColor: "green",
                    data: [14, 12, 10, 16, 9, 7, 11],
                    stack: 'Stack 0',
                }, {
                    label: 'Bad performance',
                    backgroundColor: "red",
                    data: [2, 1, 3, 4, 1, 5, 4],
                    stack: 'Stack 1' // For multiple stacking
                }],
            },
            options: {
                plugins: {
                    title: {
                        display: true,
                        text: 'Chart.js Bar Chart - Stacked'
                    },
                },
                interaction: {
                    intersect: false,
                },
                scales: {
                    x: {
                        stacked: true,
                    },
                    y: {
                        stacked: true
                    }
                },
                responsive: true
            }
        });
    </script>
</body>

</html>
输出:

 极客教程
极客教程