如何使用CanvasJS实现金融图表
在本文中,我们将学习如何使用CanvasJS插件实现金融图表。蜡烛图是一种金融图表,实时展示股票、衍生品和其他金融工具的价格走势。蜡烛图有四个关键元素需要查看,即开盘价、最高价、最低价和收盘价。它是世界上最古老的图表之一。
OHLC图表是最重要的金融图表之一,代表了股票的开盘价、最高价、最低价和收盘价。
语法:
new CanvasJS.Chart($("#ID"), {
     data: [{
          type: "candlestick",
          dataPoints: [
            {...},
        ]
      }]
});
注意: 在使用Canvas JS实现OHLC图表时,将类型属性更改为“ohlc”。
方法:
- 在HTML设计中,使用
<div>标签显示烛台或ohlc图表。 -
在代码的script部分,通过设置图书馆的type,data,datapoints和其他选项属性来实例化CanvasJS对象。
- 在代码的head部分包含CDN链接,以使用插件的功能。
- 使用Canvas JS插件的render()方法渲染图表。
- 根据以下示例代码中给定的金融图表样式的要求设置其他属性或属性。
- 根据代码实现可用的数据制作图表。
CDN链接:
<script src="https://canvasjs.com/assets/script/canvasjs.min.js"></script>
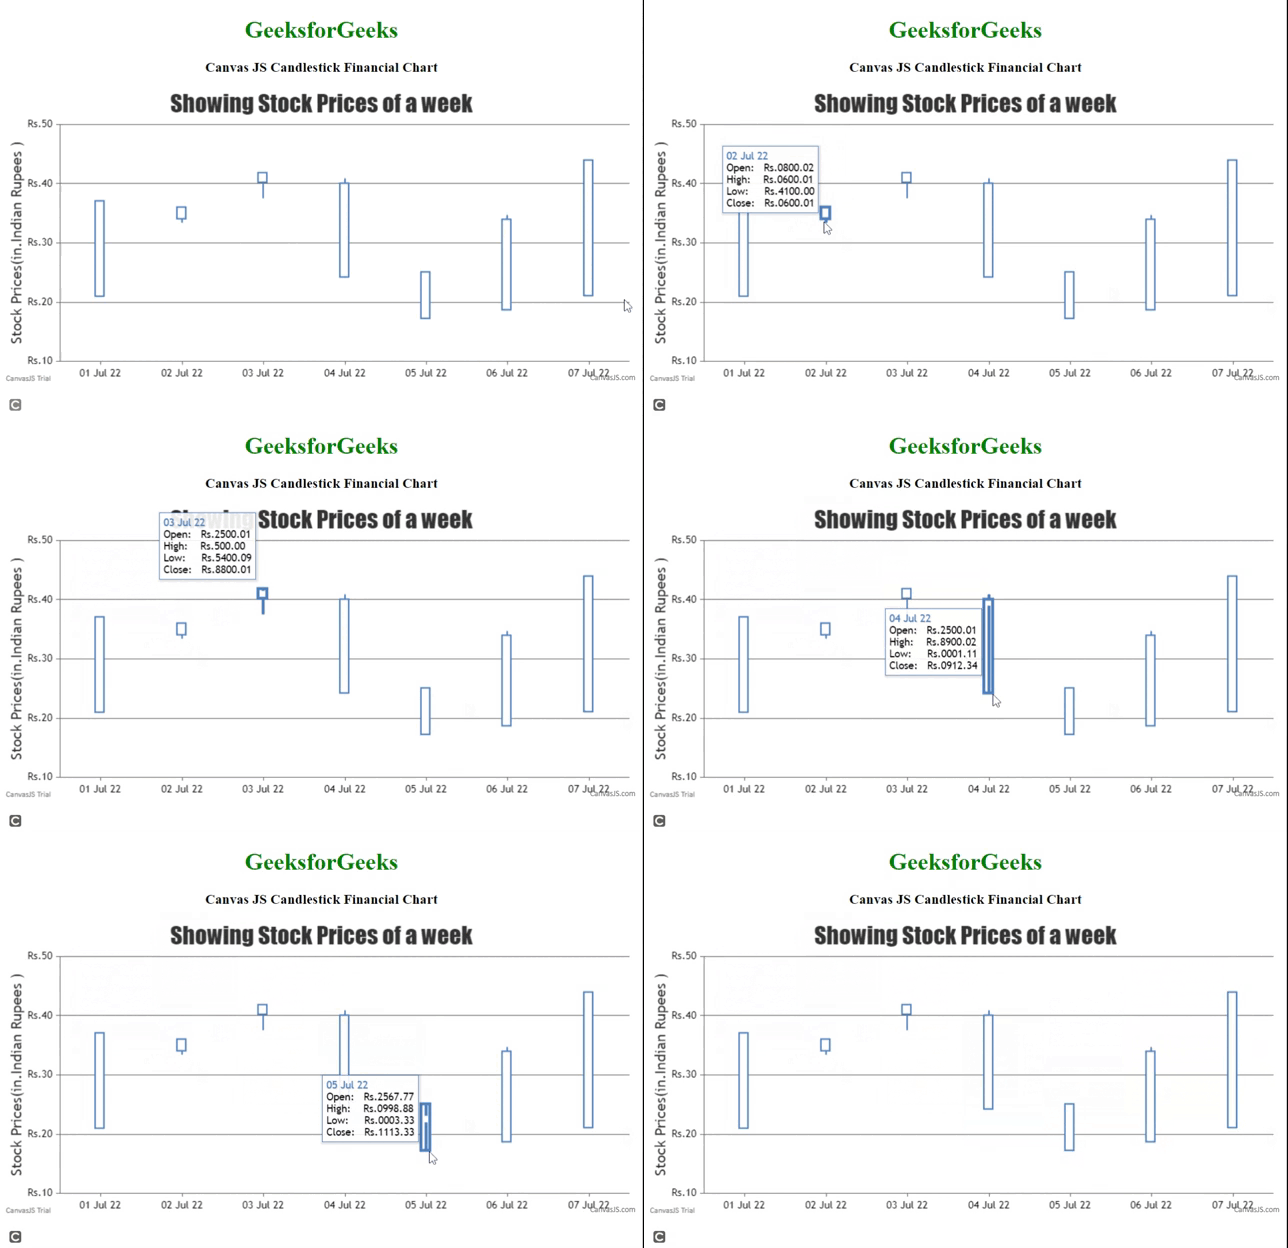
示例1: 以下代码演示了使用Canvas JS插件创建蜡烛图的基本示例。它展示了一周的股票价格,使用垂直的蜡烛柱来显示数据点的开盘价、最高价、最低价和收盘价。
HTML
<!DOCTYPE HTML>
<html>

<head>
    <script type="text/javascript" src=
"https://canvasjs.com/assets/script/jquery-1.11.1.min.js">
    </script>
    <script type="text/javascript" src=
"https://canvasjs.com/assets/script/canvasjs.min.js">
    </script>
</head>

<body>
    <div style="text-align:center">
        <h1 style="color:green;">
            GeeksforGeeks
        </h1>

        <h3>Canvas JS Candlestick Financial Chart </h3>
    </div>

    <div id="chartID" style="height:400px; max-width:950px;
            margin:0px auto;">
    </div>

    <script>
        window.onload = function () {
            var chart = new CanvasJS.Chart("chartID", {
                title: {
                    text: "Showing Stock Prices of a week"
                },
                axisY: {
                    prefix: "Rs.",
                    title: "Stock Prices(in.Indian Rupees )",
                },
                axisX: {
                    valueFormatString: "DD MMM YY"
                },
                data: [
                    {
                        type: "candlestick",
                        yValueFormatString: "Rs.##00.00",
                        xValueFormatString: "DD MMM YY",
                        dataPoints: [
                            {
                                x: new Date(2022, 06, 01),
                                y: [21.000787, 36.100091, 33.000888, 37.111222]
                            },
                            {
                                x: new Date(2022, 06, 02),
                                y: [34.080002, 36.060001, 33.410000, 36.060001]
                            },
                            {
                                x: new Date(2022, 06, 03),
                                y: [40.250001, 41.500000, 37.540009, 41.880001]
                            },
                            {
                                x: new Date(2022, 06, 04),
                                y: [24.250001, 40.890002, 39.000111, 40.091234]
                            },
                            {
                                x: new Date(2022, 06, 05),
                                y: [17.256777, 23.099888, 22.000333, 25.111333]
                            },
                            {
                                x: new Date(2022, 06, 06),
                                y: [18.710001, 34.700005, 32.099002, 34.000111]
                            },
                            {
                                x: new Date(2022, 06, 07),
                                y: [21.100002, 42.099888, 43.890002, 44.000234]
                            }
                        ]
                    }
                ],// end data
            });// end chart
            chart.render();
        }// window onload
    </script>
</body>

</html>
输出:

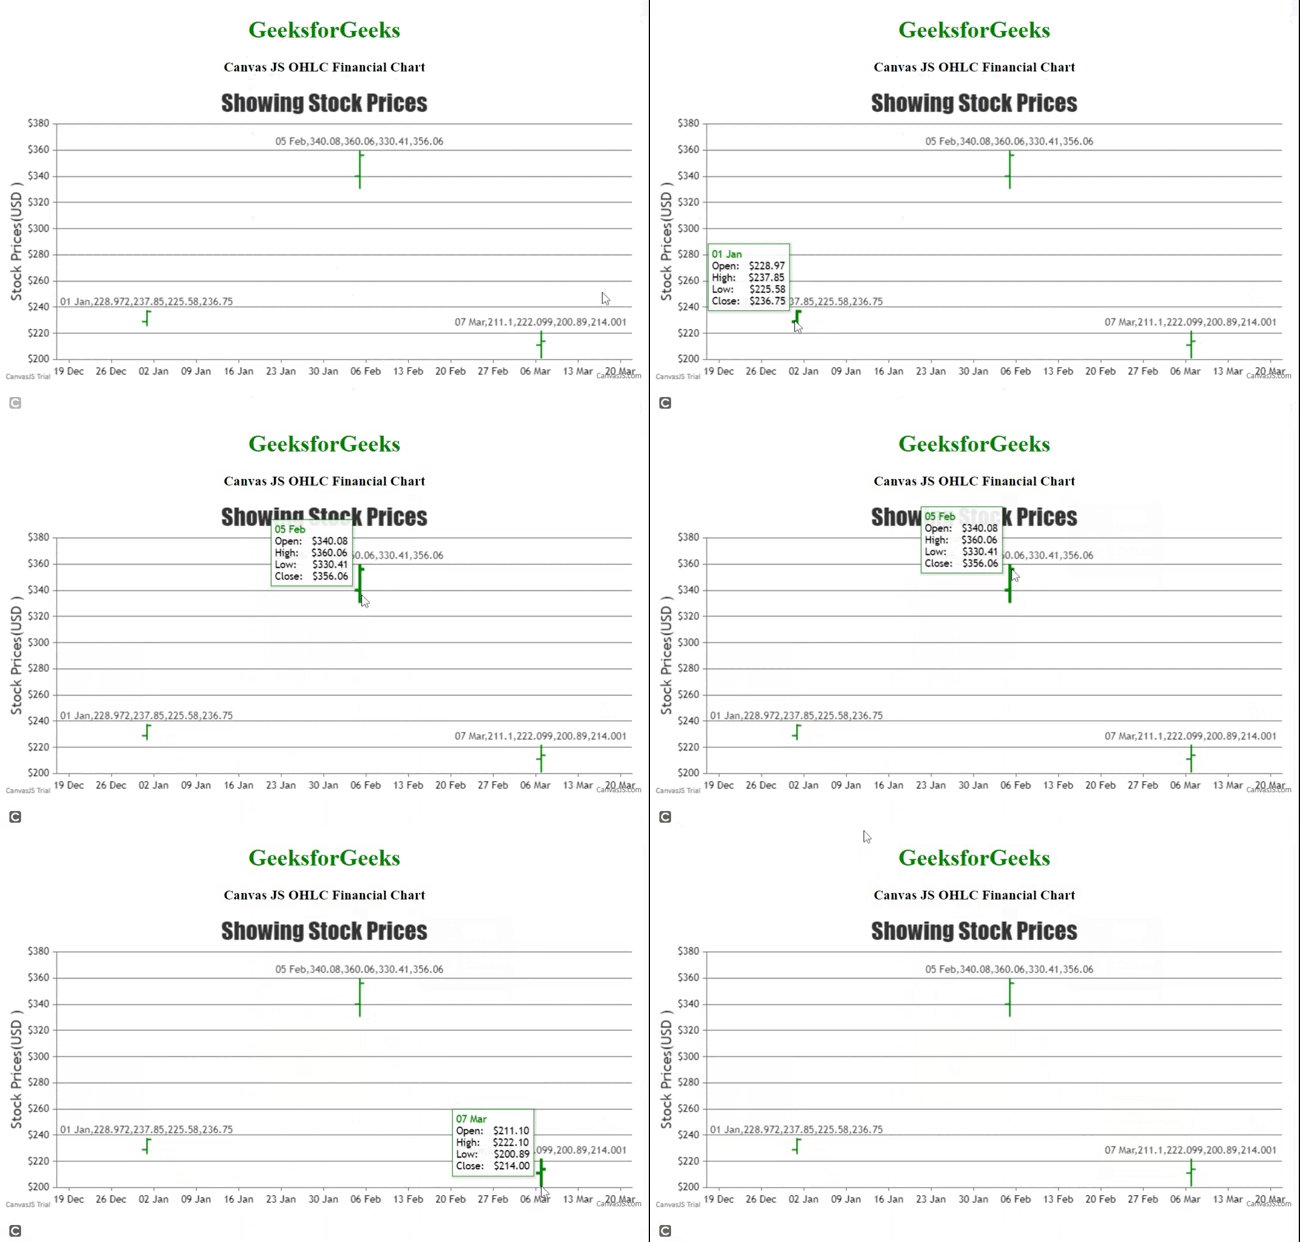
示例2: 下面的代码演示了简单的OHLC图表,与烛台图表类似,不同之处在于垂直线上显示开盘和收盘价格的左右两侧有刻度标记。为了演示,只添加了少量数据点。开发者可以根据需要设置其他选项并添加更多数据点。
HTML
<!DOCTYPE HTML>
<html>

<head>
    <script type="text/javascript" src=
"https://canvasjs.com/assets/script/jquery-1.11.1.min.js">
    </script>
    <script type="text/javascript" src=
"https://canvasjs.com/assets/script/canvasjs.min.js">
    </script>
</head>

<body>
    <div style="text-align:center">
        <h1 style="color:green;">
            GeeksforGeeks
        </h1>

        <h3>Canvas JS OHLC Financial Chart </h3>
    </div>

    <div id="chartID" style="height:400px; max-width:950px;
            margin:0px auto;">
    </div>

    <script>
        window.onload = function () {
            var options = {
                title: {
                    text: "Showing Stock Prices"
                },
                axisY: {
                    prefix: "",
                    title: "Stock Prices(USD )",
                },
                axisX: {
                    valueFormatString: "DD MMM"
                },
                data: [
                    {
                        type: "ohlc",
                        color: "green",
                        indexLabel: "{x},{y}",
                        yValueFormatString: "##0.00",
                        xValueFormatString: "DD MMM",
                        dataPoints: [
                            {
                                x: new Date(2022, 0, 01),
                                y: [228.972, 237.850, 225.580, 236.750]
                            },
                            {
                                x: new Date(2022, 1, 05),
                                y: [340.080, 360.060, 330.410, 356.060]
                            },
                            {
                                x: new Date(2022, 2, 07),
                                y: [211.100, 222.099, 200.890, 214.001]
                            }
                        ]
                    }
                ],// End data
            }// Options

            var chart = new CanvasJS.Chart("chartID", options);

        }// window onload
    </script>
</body>

</html>
输出:

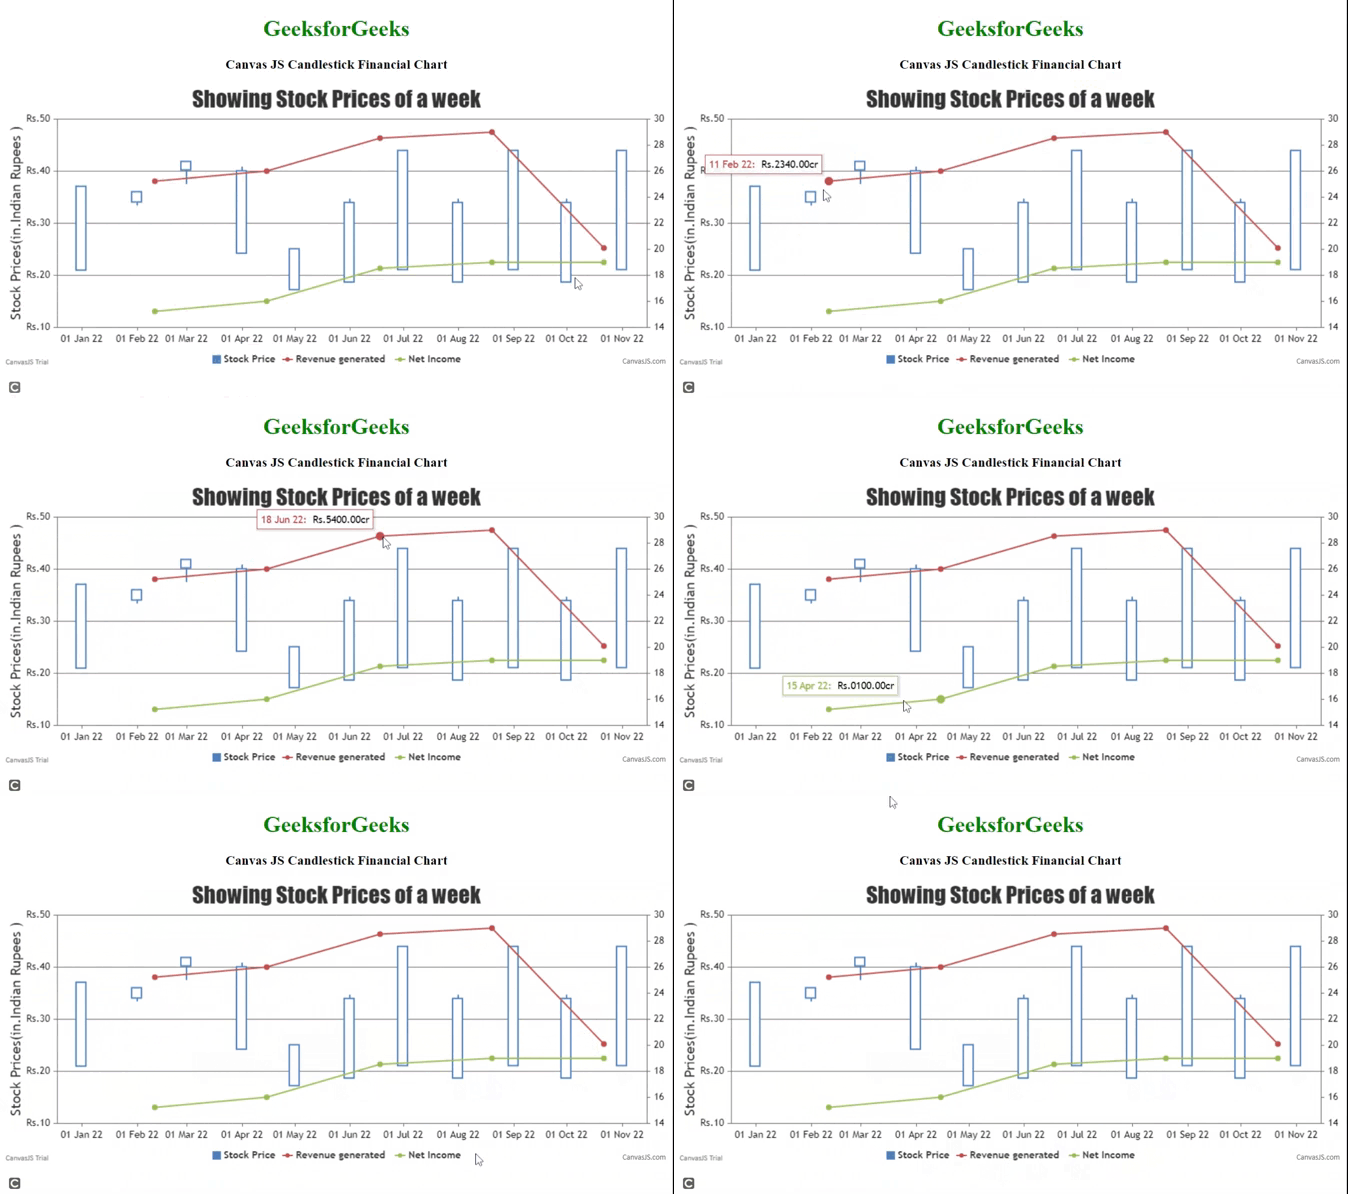
示例3: 我们还可以实现组合图表用于财务分析,例如将K线图与折线图相结合。以下代码显示了股票价格以及生成的总营收和净收入。
HTML
<!DOCTYPE HTML>
<html>
<head>
    <script type="text/javascript" src=
"https://canvasjs.com/assets/script/jquery-1.11.1.min.js">
    </script>
    <script type="text/javascript" src=
"https://canvasjs.com/assets/script/canvasjs.min.js">
    </script>
</head>
<body>
    <div style="text-align:center">
        <h1 style="color:green">GeeksforGeeks</h1>
        <h3>Canvas JS Candlestick Line Financial Chart </h3>
    </div>
    <div id="chartID"
         style="height:400px; max-width:950px;
             margin:0px auto;">
    </div>
    <script>
        window.onload = function () {
            var chart = new CanvasJS.Chart("chartID", {
                title: {
                     text: "Showing Stock Prices of a week"
                },
                axisY: {
                    prefix: "Rs.",
                    title: "Stock Prices(in.Indian Rupees )",
                },
                axisX: {
                    valueFormatString: "DD MMM YY"
                },
                data: [
                {
                    type: "candlestick",
                    showInLegend: true,
                    name: "Stock Price",
                    yValueFormatString: "Rs.##00.00",
                    xValueFormatString: "DD MMM YY",
                    dataPoints: [
                        { x: new Date(2022,0,01),
                          y: [21.000787, 36.100091,33.000888,37.111222] },
                        { x: new Date(2022,01,01),
                          y: [34.080002, 36.060001, 33.410000, 36.060001]},
                        { x: new Date(2022,02,01),
                          y: [40.250001, 41.500000, 37.540009, 41.880001]},
                        { x: new Date(2022,03,01),
                          y: [24.250001, 40.890002,39.000111,40.091234] },
                        { x: new Date(2022,04,01),
                          y: [17.256777, 23.099888,22.000333,25.111333] },
                        { x: new Date(2022,05,01),
                          y: [18.710001, 34.700005,32.099002,34.000111] },
                        { x: new Date(2022,06,01),
                          y: [21.100002, 42.099888,43.890002,44.000234] },
                        { x: new Date(2022,07,01),
                          y: [18.710001, 34.700005,32.099002,34.000111] },
                        { x: new Date(2022,08,01),
                          y: [21.100002, 42.099888,43.890002,44.000234] },
                        { x: new Date(2022,09,01),
                          y: [18.710001, 34.700005,32.099002,34.000111] },
                        { x: new Date(2022,10,01),
                          y: [21.100002, 42.099888,43.890002,44.000234] }
                    ]
                },
                {
                    type: "line",
                    showInLegend: true,
                    yValueFormatString: "Rs.##00.00cr",
                    xValueFormatString: "DD MMM YY",
                    name: "Revenue generated",
                    axisYType: "secondary",
                    dataPoints:[
                        { x: new Date(2022,01,11), y: 25.234 },
                        { x: new Date(2022,03,15), y: 26.010 },
                        { x: new Date(2022,05,18), y: 28.540 },
                        { x: new Date(2022,07,20), y: 29.001 },
                        { x: new Date(2022,09,22), y: 20.099 }
                    ]
                },
                {
                    type: "line",
                    showInLegend: true,
                    yValueFormatString: "Rs.##00.00cr",
                    xValueFormatString: "DD MMM YY",
                    name: "Net Income",
                    axisYType: "secondary",
                    dataPoints:[
                        { x: new Date(2022,01,11), y: 15.234 },
                        { x: new Date(2022,03,15), y: 16.010 },
                        { x: new Date(2022,05,18), y: 18.540 },
                        { x: new Date(2022,07,20), y: 19.001 },
                        { x: new Date(2022,09,22), y: 18.999 }
                    ]
                }
                ],// end data

            });// end chart
            chart.render();
        }// window onload
    </script>
</body>
</html>
输出:

结论: 我们使用财务图表根据适用性展示一段时间内的价格走势,包括开盘价、最高价、最低价和收盘价。选择的任何图表类型都应该提供适合项目策略的重要信息。
 极客教程
极客教程