如何使用CanvasJS实现箱线图和须髯图
在本文中,我们将学习如何使用Canvas JS插件来实现箱线图和须髯图。
箱线图在通过四分位数及其离群值的可视化表示中对数值数据组的表示非常有用。它通过一些方框和须髯展示了数据组的汇总信息,有助于在数据组之间进行简单的比较。离群值是指超出数据点的最小和最大值的值,通常用十字或圆圈来表示。
语法:
 new CanvasJS.Chart($("#ID"), {
  data: [{
      type: "boxAndWhisker",
      dataPoints: [
        {...},
    ]
  }]
});
操作方法:
- 在HTML设计中,使用
<div>标签来显示范围图表。- 在代码的
script部分,通过设置库的type, data, datapoints和其他选项属性来实例化CanvasJS对象。 - 在代码的
head部分包含CDN链接以使用插件的功能。 - 使用Canvas JS插件的render()方法呈现图表。
- 根据以下示例代码中给出的样式设置所需的其他属性或属性以进行图表的样式化。
- 根据可用的数据制作图表以供代码实现。
- 在代码的
CDN 链接:
<script src="https://canvasjs.com/assets/script/canvasjs.min.js"></script>
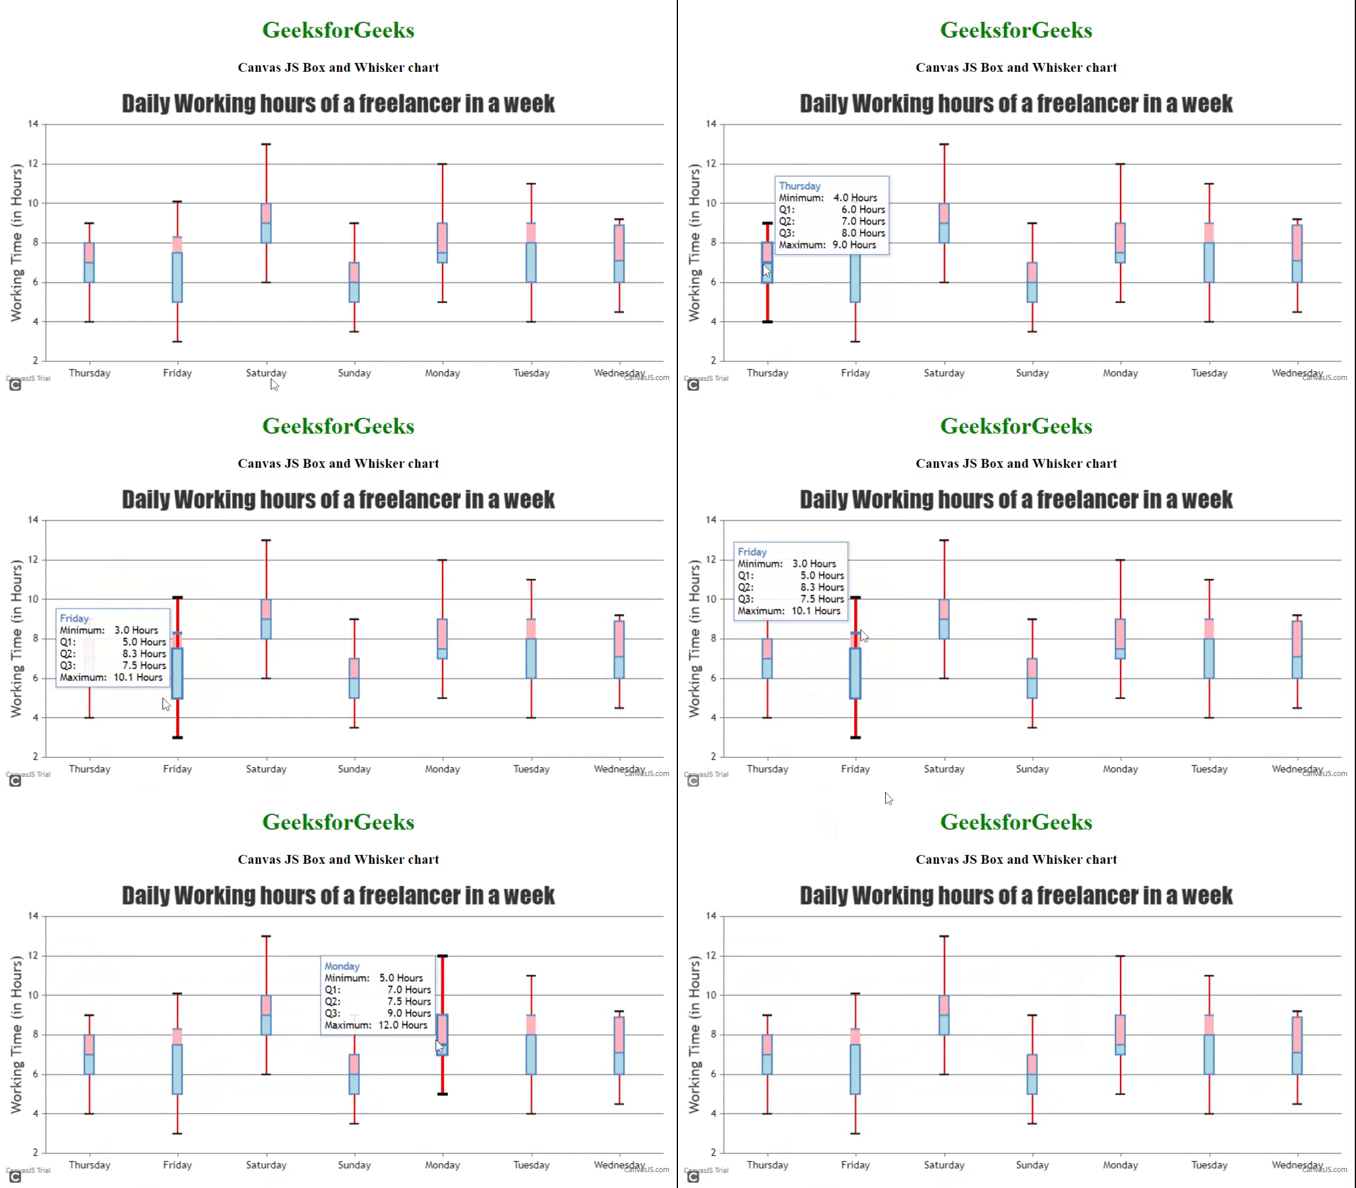
示例 1: 下面的代码演示了一个简单的箱型图和须图,显示自由职业者一周内每天的工作小时数。它以最小值、最大值和中位数数据进行数值分布,使用不同的数据属性进行了颜色设置。
<!DOCTYPE HTML>
<html>
<head>
    <script type="text/javascript" src=
"https://canvasjs.com/assets/script/canvasjs.min.js">
    </script>
</head>
<body>
    <div style="text-align:center">
        <h1 style="color:green">GeeksforGeeks</h1>
        <h3>Canvas JS Box and Whisker chart</h3>
    </div>
    <div id="chartID"
        style="height:400px; max-width:950px;
        margin:0px auto;">
    </div>
    <script>
        window.onload = function () {
            var chart = new CanvasJS.Chart("chartID", {

                title:{
                    text: "Daily Working hours of a freelancer in a week"
                },
                axisY: {
                    title: "Working Time (in Hours)"
                },
                axisX: {
                        valueFormatString: "DDDD"
                },
                data: [
                {
                    type: "boxAndWhisker",
                    xValueFormatString: "DDDD",
                    yValueFormatString: "#0.0 Hours",
                    upperBoxColor: "lightpink",
                    lowerBoxColor: "lightblue",
                    stemColor:"red",
                    whiskerColor:"black",
                    dataPoints: [
                        { x: new Date(2023,05,01), y:[4, 6, 8, 9, 7] },
                        { x: new Date(2023,05,02), y:[3,5,7.5,10.1,8.3] },
                        { x: new Date(2023,05,03), y:[6,8,10,13,9] },
                        { x: new Date(2023,05,04), y:[3.5,5,7,9,6] },
                        { x: new Date(2023,05,05), y:[5,7,9,12,7.5] },
                        { x: new Date(2023,05,06), y:[4,6,8,11,9] },
                        { x: new Date(2023,05,07), y:[4.5,6,8.9,9.2,7.1] }

                    ]// datapoints
            }]// end data
        });// canvas chart
        // Render chart in the HTML div
        chart.render();
        }// window onload
    </script>
</body>
</html>
输出:

示例 2: 下面的代码还演示了一个箱型图和须图,显示不同职位的月薪。它还使用“散点”图类型来展示超出任何月薪最小值和最大值范围的异常值,用绿色圆圈表示。它只是对数据的一些粗略估计或摘要。
- HTML
<!DOCTYPE HTML>
<html>
<head>
    <script type="text/javascript" src=
"https://canvasjs.com/assets/script/canvasjs.min.js">
    </script>
</head>
<body>
    <div style="text-align:center">
        <h1 style="color:green">GeeksforGeeks</h1>
        <h3>Canvas JS Box and Whisker chart</h3>
    </div>
    <div id="chartID"
        style="height:400px; max-width:950px;
            margin:0px auto;">
    </div>
    <script>
        window.onload = function () {
            var chart = new CanvasJS.Chart("chartID", {
                title:{
                    text: "Monthly Salary of different jobs in India"
                },
                axisY: {
                        title: "Monthly Salary (in India)",
                        prefix: "Rs.",
                        interval: 8000
                },
                data: [
                {
                    type: "boxAndWhisker",
                    upperBoxColor: "lightgreen",
                    lowerBoxColor: "blue",
                    stemColor:"red",
                    dataPoints: [
                        { label: "Teacher",
                        y:[13360, 15320, 18490, 20165, 16800] },
                        { label: "Chef",
                        y:[13600, 15932, 18249, 20000, 17500] },
                        { label: "Doctor",
                        y:[42000, 54000, 68000, 79000, 57000] },
                        { label: "Fashion Designer",
                        y:[22000, 34000, 48000, 59000, 38900] },
                        { label: "Engineer",
                        y:[62000, 70600, 90000, 100000, 80000] },
                        { label: "Security guard",
                        y:[14600, 15500, 18200, 21000, 17100] },
                        { label: "Freelancer",
                        y:[17000, 18400, 21500, 23500, 19999] },
                        { label: "Driver",
                        y:[12636, 15532, 18249, 19265, 17100] }
                    ]// datapoints
            },
            {
                    type: "scatter",
                    markerType:"circle",
                    markerColor:"green",
                    name: "Outlier Values",
                    toolTipContent: "{name}: Rs.{y} ",
                    showInLegend: true,
                    dataPoints: [
                        { x: 7, label: "Driver", y: 12500 },
                        { x: 0, label: "Teacher", y: 13000 },
                        { x: 1, label: "Chef", y: 13100 },
                        { x: 4, label: "Engineer", y: 102000 },
                        { x: 4, label: "Engineer", y: 61000 },
                        { x: 3, label: "Fashion Designer", y: 19000 },
                        { x: 3, label: "Fashion Designer", y: 61000 }
                    ]//end datapoints
                } // end scatter type

            ]// end data
        });// canvas chart
        // Render chart in the HTML div
        chart.render();
        }// window onload
    </script>
</body>
</html>
输出:

结论: 箱型图和须图很有用,因为它们展示了数据点的离散程度以及其中一些与实际数据集中其余部分有较大差距的异常值。
 极客教程
极客教程