如何使用CanvasJS实现Range Charts
在本文中,我们将学习如何使用CanvasJS插件实现Range Charts。
Range Charts用于显示不同范围的值,如低值和高值之间的时间跨度,使用范围而不是特定值来强调两个值之间的距离。 Range Charts通常有以下几种类型。
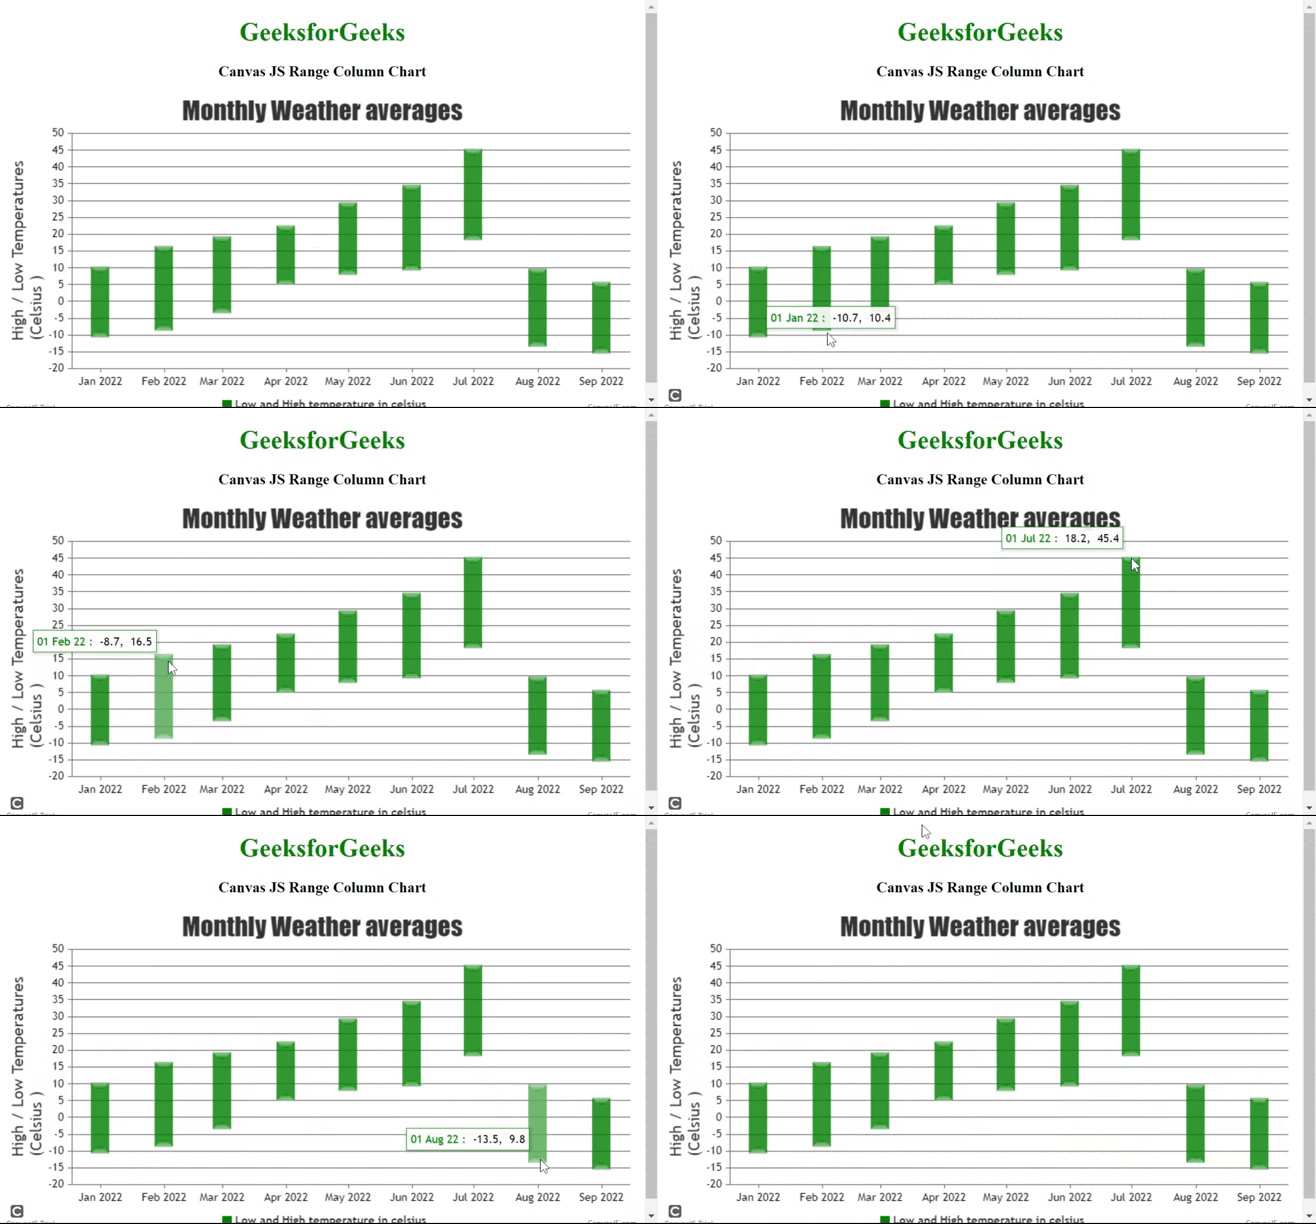
- Range Column Charts: Range Column Charts使用柱状图表示范围。除了y轴有两个值(低值和高值)之外,它们与柱状图非常相似。它们通常用于显示在一天、一周、一个月或一年的时间跨度内的值的变化。
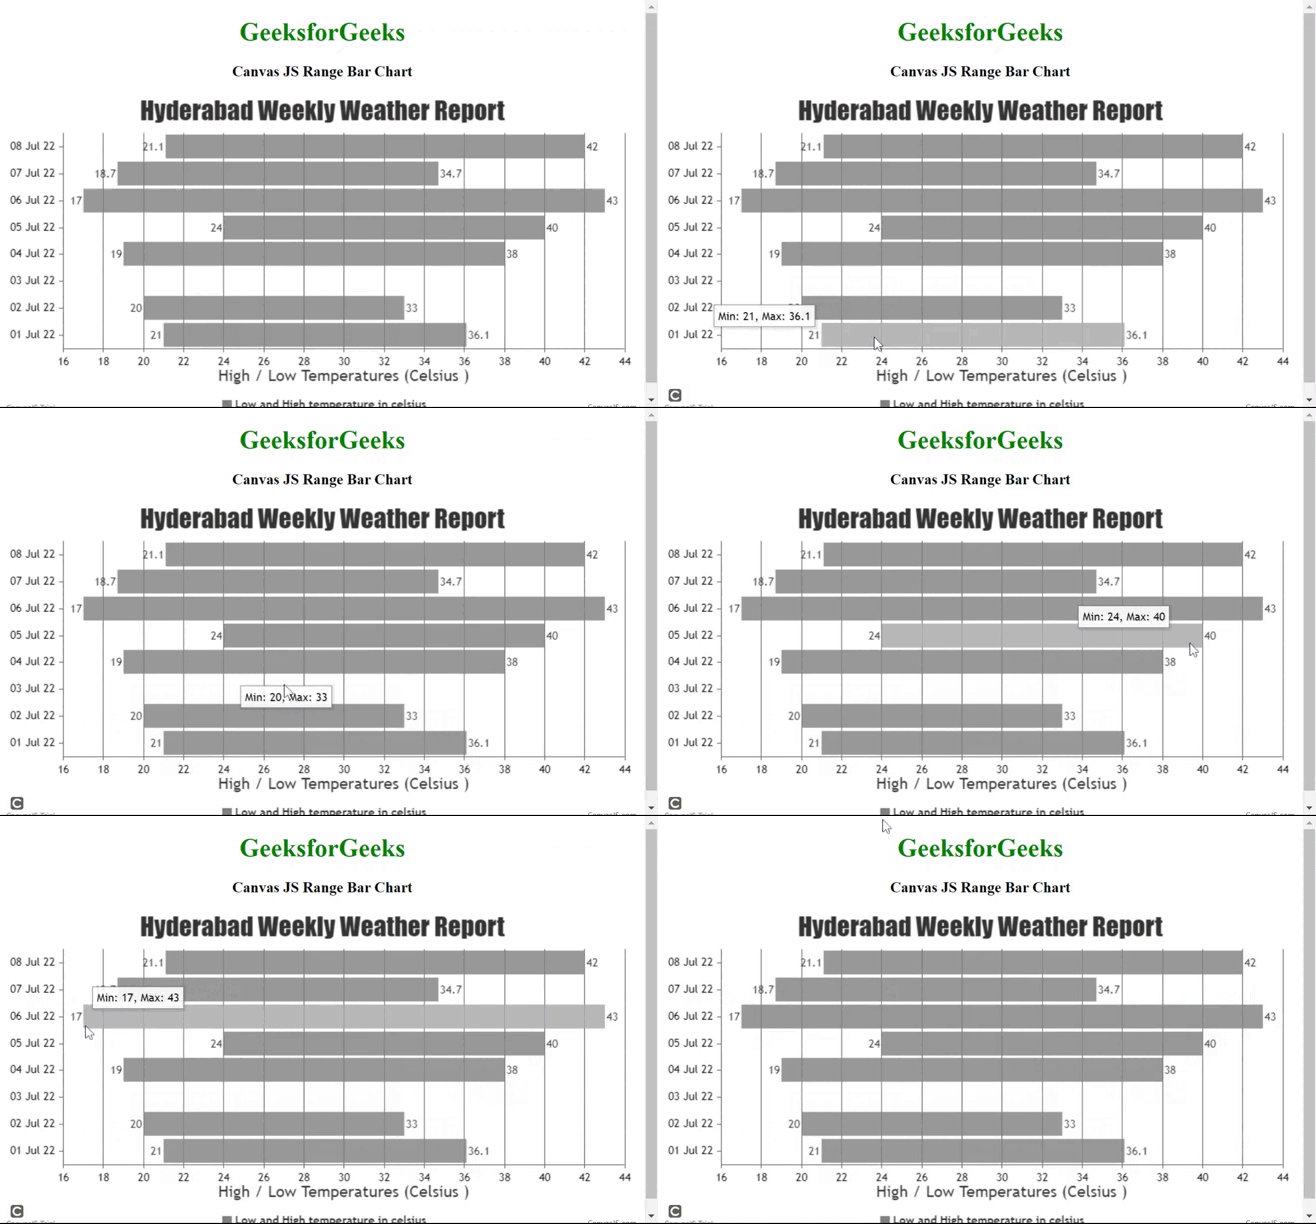
- Range Bar Charts: Range Bar Charts使用条形图表示范围。它们与Range Column Charts非常相似,只是x轴是垂直的,y轴是水平的。
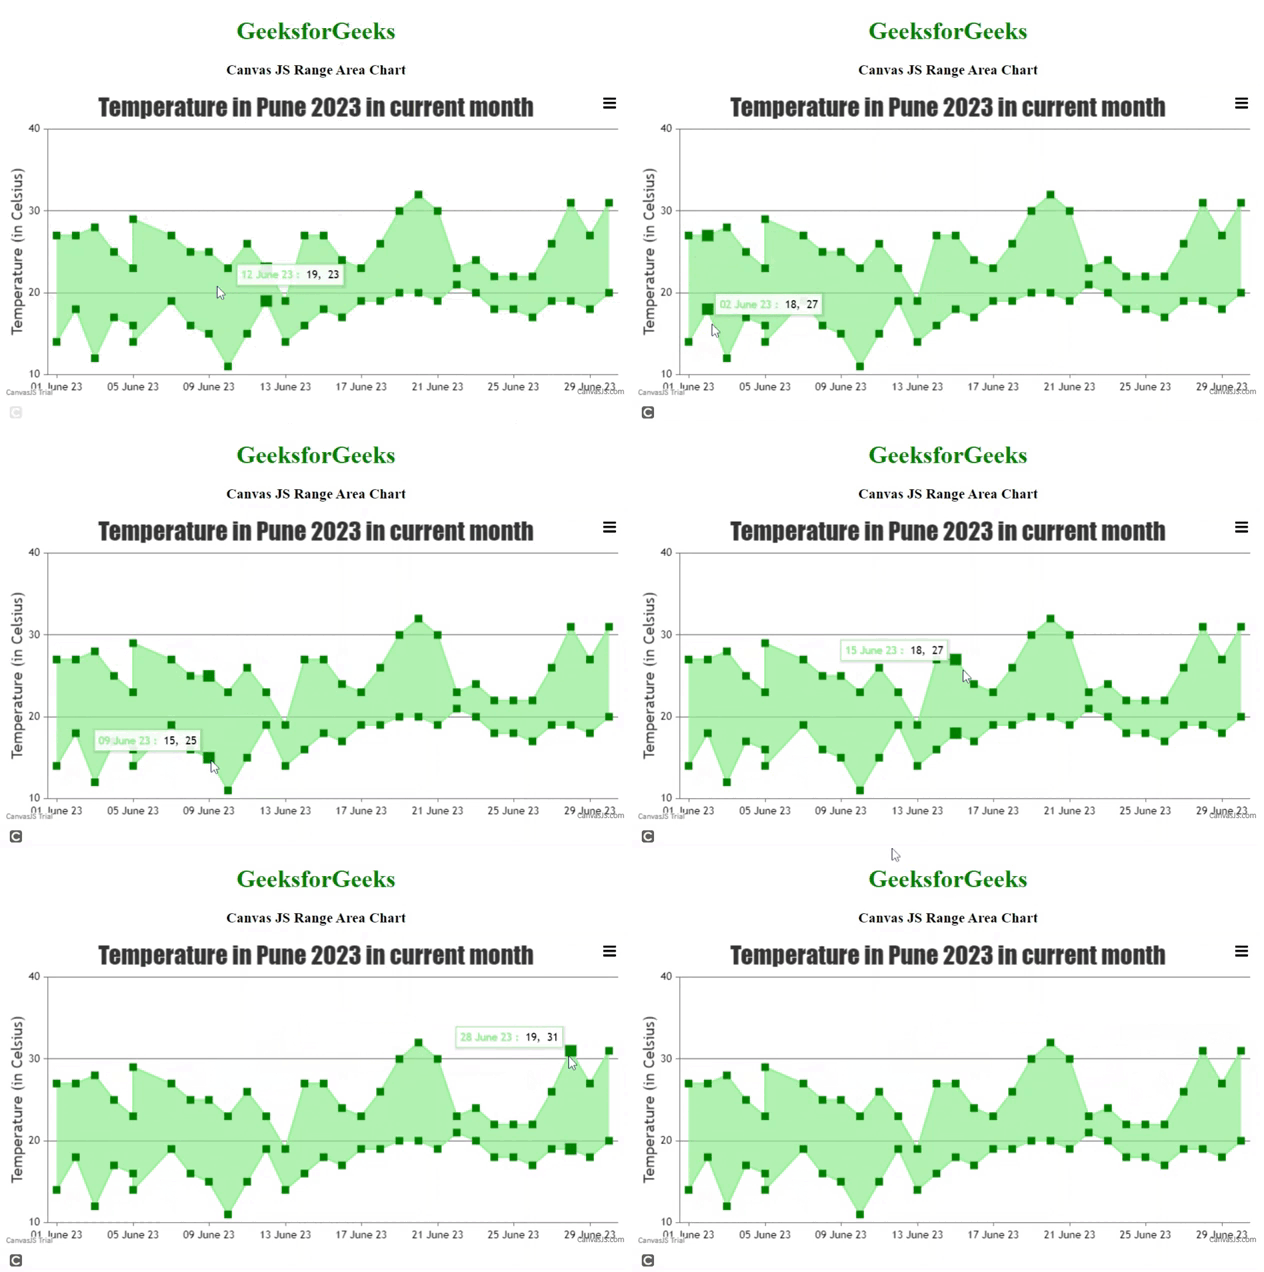
- Range Area Charts: Range Area Charts使用值范围(低值和高值)之间的区域进行绘制。它们主要用于显示给定时间范围内的变化,非常交互。
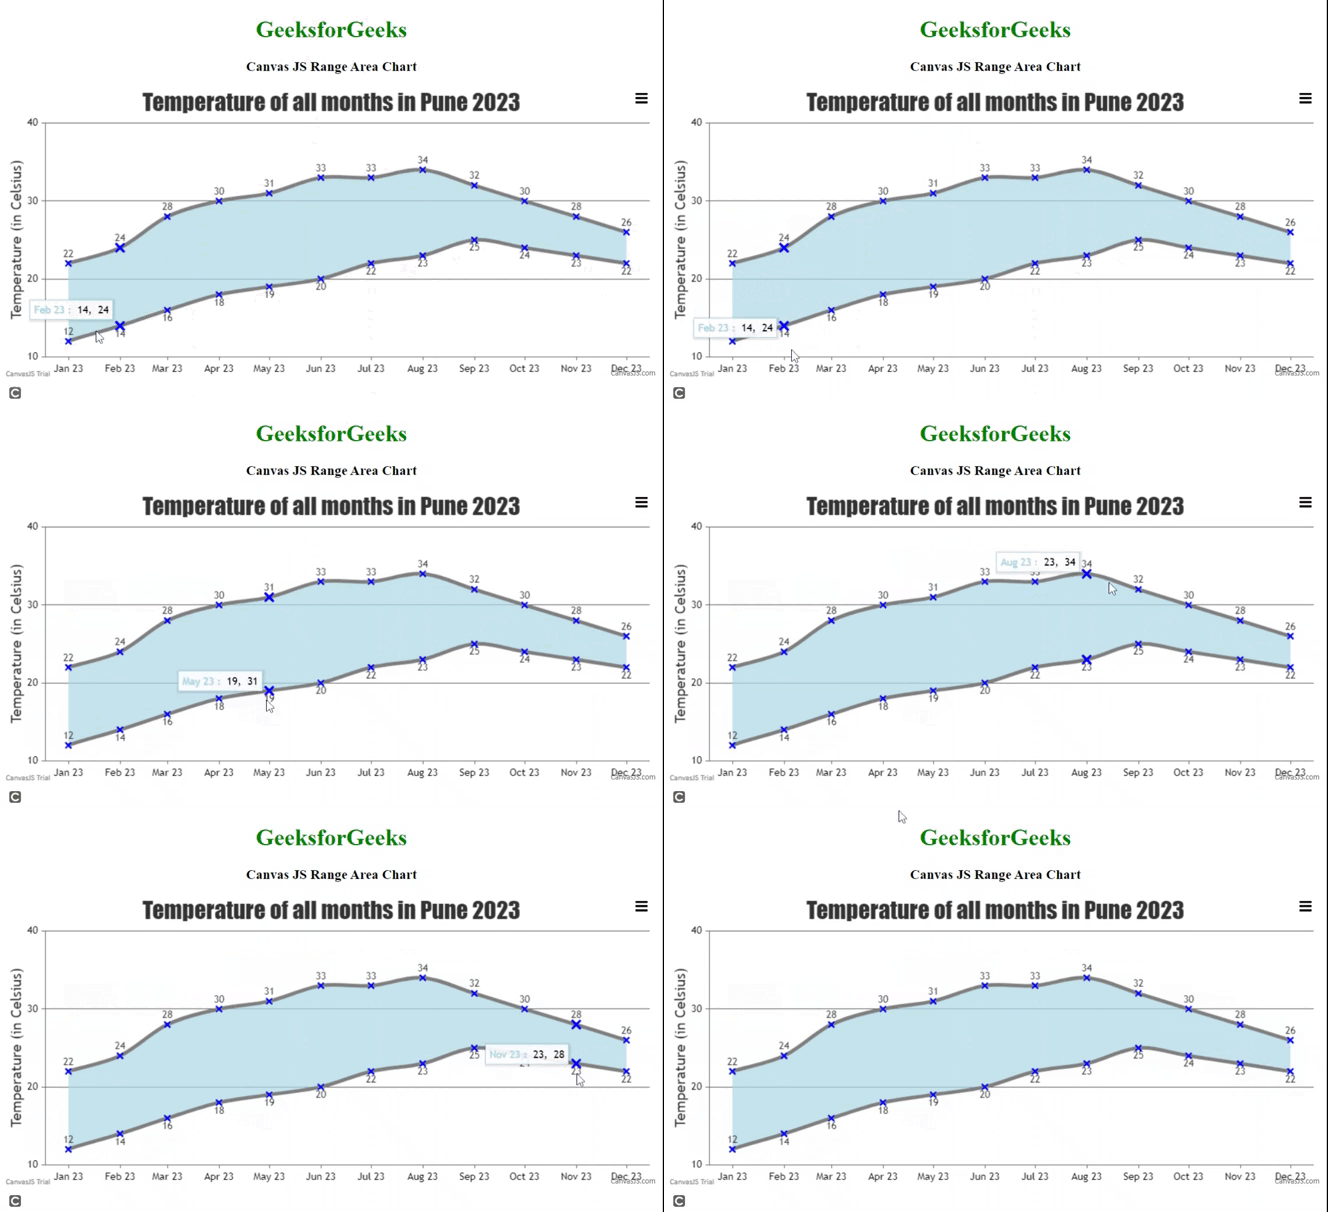
- Range Spline Area Charts: Range Spline Area Charts使用平滑曲线连接数据点,而不是直线。它们与Range Area Charts非常相似,只是使用平滑曲线。
语法:
new CanvasJS.Chart($("#ID"), {
  data: [{
      type: "rangeBar",
      dataPoints: [
        {...},
    ]
  }]
});
注意: 根据数据点可用情况, type 属性可以取值为”rangeColumn”、”rangeArea”、”rangeSplineArea”。
步骤:
- 在HTML设计中,使用
<
div>标签显示范围图表。
* 在代码的script部分,通过设置库的type、data、datapoints和其他选项属性来实例化CanvasJS对象。
* 在代码的head部分包含CDN链接以使用插件的功能。
* 使用Canvas JS插件的render()方法渲染图表。
* 根据以下示例代码中的要求设置其他属性或样式来设置图表的样式。
* 根据可用的数据创建图表以进行代码实现。
CDN链接:
<script src="https://canvasjs.com/assets/script/canvasjs.min.js"></script>
示例1: 下面的代码演示了简单的区间柱状图。它以柱状图的形式展示了2022年几个月的温度范围。
HTML
<!DOCTYPE HTML>
<html>
<head>
    <script type="text/javascript" src=
"https://canvasjs.com/assets/script/canvasjs.min.js">
    </script>
</head>
<body>
    <div style="text-align:center">
        <h1 style="color:green">GeeksforGeeks</h1>
        <h3>Canvas JS Range Column Chart </h3>
    </div>
    <div id="chartID"
         style="height:400px; max-width:950px;
            margin:0px auto;">
    </div>
    <script>
        window.onload = function () {
            var chart = new CanvasJS.Chart("chartID", {
                title: {
                     text: "Monthly Weather averages"
                },
                axisY: {
                    includeZero: true,
                    // Y axis Temperatures with 5 interval gap
                    interval: 5,
                    title: "High / Low Temperatures (Celsius )",
                },
                axisX: {
                    interval: 1,
                  // x axis intervaltype is in month
                    intervalType: "month",
                    valueFormatString: "MMM YYYY"
                },
                data: [
                {
                    type: "rangeColumn",
                     // columns having chiselled effect
                    bevelEnabled: true,
                    // Bottom legend setting
                    showInLegend: true,
                    legendText: "Low and High temperature in celsius",
                    fillOpacity: 0.8,
                    color: "green",
                    dataPoints: [
                        // y: [Low ,High]
                        { x: new Date(2022,00,01), y: [-10.7, 10.4] },
                        { x: new Date(2022,01,01), y: [-8.7, 16.5] },
                        { x: new Date(2022,02,01), y: [-3.5, 19.4] },
                        { x: new Date(2022,03,01), y: [5.0, 22.6] },
                        { x: new Date(2022,04,01), y: [7.9, 29.5] },
                        { x: new Date(2022,05,01), y: [9.2, 34.7] },
                        { x: new Date(2022,06,01), y: [18.2, 45.4] },
                        { x: new Date(2022,07,01), y: [-13.5, 9.8] },
                        { x: new Date(2022,08,01), y: [-15.5, 5.8] }
                    ]
                }
                ]// end data
            });// end chart
            chart.render();
        }// window onload
    </script>
</body>
</html>
输出:

示例 2: 下面的代码演示了水平方向的范围条形图。使用属性进行了不同的设置或格式设置。
HTML
<!DOCTYPE HTML>
<html>
<head>
    <script type="text/javascript" src=
"https://canvasjs.com/assets/script/canvasjs.min.js">
    </script>
</head>
<body>
    <div style="text-align:center">
        <h1 style="color:green">GeeksforGeeks</h1>
        <h3>Canvas JS Range Bar Chart </h3>
    </div>
    <div id="chartID"
         style="height:400px; max-width:950px;
            margin:0px auto;">
    </div>
    <script>
        window.onload = function () {
            var chart = new CanvasJS.Chart("chartID", {
                title: {
                     text: "Hyderabad Weekly Weather Report"
                },
                axisY: {
                    includeZero: false,//It will not include 0
                    // the gap between the x-axis temperatures
                    interval: 2,
                    title: "High / Low Temperatures (Celsius )",
                },
                axisX: {
                    interval: 1,
                    valueFormatString: "DD MMM YY"
                },
                data: [
                {
                    type: "rangeBar",
                   // Bottom legend setting
                    showInLegend: true,
                    legendText: "Low and High temperature in celsius",
                    fillOpacity: 0.8,
                    color: "gray",
                    indexLabel: "{y[#index]}",
                    dataPoints: [
                        // y: [Low ,High]
                        { x: new Date(2022,06,01), y: [21, 36.1] },
                        { x: new Date(2022,06,02), y: [20, 33] },
                        { x: new Date(2022,06,04), y: [19, 38] },
                        { x: new Date(2022,06,05), y: [24, 40] },
                        { x: new Date(2022,06,06), y: [17, 43] },
                        { x: new Date(2022,06,07), y: [18.7, 34.7] },
                        { x: new Date(2022,06,08), y: [21.1, 42] },
                    ]
                }
                ],// end data
                // Tooltip setting for the bar ranges
                // Hover over the bars ro see the effect
                toolTip: {
                    content: " Min: {y[0]}, Max: {y[1]}"
                }
            });// end chart
            chart.render();
        }// window onload
    </script>
</body>
</html>
输出:

示例3: 下面的代码演示了范围区域图表,显示了单个月份内不同温度范围。该图表通过绘制低点和高点之间的阴影区域来展示。标记的样式使用代码中实现的不同属性进行设置。
HTML
<!DOCTYPE HTML>
<html>
<head>
    <script type="text/javascript" src=
"https://canvasjs.com/assets/script/canvasjs.min.js">
    </script>
</head>
<body>
    <div style="text-align:center">
        <h1 style="color:green">GeeksforGeeks</h1>
        <h3>Canvas JS Range Area Chart </h3>
    </div>
    <div id="chartID"
         style="height:400px; max-width:950px;
            margin:0px auto;">
    </div>
    <script>
        window.onload = function () {
            var chart = new CanvasJS.Chart("chartID", {
                exportEnabled: true,
                fillOpacity: .6,
                title:{
                    text: "Temperature in Pune 2023 in current month"
                },
                axisY: {
                    title: "Temperature (in Celsius)"
                },
                axisX: {
                        valueFormatString: "DD MMMM YY"
                },
                data: [
                {
                    type: "rangeArea",
                    xValueFormatString: "DD MMMM YY",
                    color: "lightgreen",
                    markerSize: 10,
                    markerType: "square",
                    markerColor: "green",
                    dataPoints: [
                        { x: new Date(2023,05,01), y:[14, 27] },
                        { x: new Date(2023,05,02), y:[18, 27] },
                        { x: new Date(2023,05,03), y:[12, 28] },
                        { x: new Date(2023,05,04), y:[17, 25] },
                        { x: new Date(2023,05,05), y:[16, 23] },
                        { x: new Date(2023,05,05), y:[14, 29] },
                        { x: new Date(2023,05,07), y:[19, 27] },
                        { x: new Date(2023,05,08), y:[16, 25] },
                        { x: new Date(2023,05,09), y:[15, 25] },
                        { x: new Date(2023,05,10), y:[11, 23] },
                        { x: new Date(2023,05,11), y:[15, 26] },
                        { x: new Date(2023,05,12), y:[19, 23] },
                        { x: new Date(2023,05,13), y:[14, 19] },
                        { x: new Date(2023,05,14), y:[16, 27] },
                        { x: new Date(2023,05,15), y:[18, 27] },
                        { x: new Date(2023,05,16), y:[17, 24] },
                        { x: new Date(2023,05,17), y:[19, 23] },
                        { x: new Date(2023,05,18), y:[19, 26] },
                        { x: new Date(2023,05,19), y:[20, 30] },
                        { x: new Date(2023,05,20), y:[20, 32] },
                        { x: new Date(2023,05,21), y:[19, 30] },
                        { x: new Date(2023,05,22), y:[21, 23] },
                        { x: new Date(2023,05,23), y:[20, 24] },
                        { x: new Date(2023,05,24), y:[18, 22] },
                        { x: new Date(2023,05,25), y:[18, 22] },
                        { x: new Date(2023,05,26), y:[17, 22] },
                        { x: new Date(2023,05,27), y:[19, 26] },
                        { x: new Date(2023,05,28), y:[19, 31] },
                        { x: new Date(2023,05,29), y:[18, 27] },
                        { x: new Date(2023,05,30), y:[20, 31] },
                    ]// datapoints
               }]// end data
           });// canvas chart
          // Render chart in the HTML div
           chart.render();
        }// window onload
    </script>
</body>
</html>
输出:

示例4: 下面的代码展示了 Range Spline 面积图,表示2023年所有月份的平滑温度范围。
HTML
<!DOCTYPE HTML>
<html>
<head>
    <script type="text/javascript" src=
"https://canvasjs.com/assets/script/canvasjs.min.js">
    </script>
</head>
<body>
    <div style="text-align:center">
        <h1 style="color:green">GeeksforGeeks</h1>
        <h3>Canvas JS Range Area Chart </h3>
    </div>
    <div id="chartID"
         style="height:400px; max-width:950px;
            margin:0px auto;">
    </div>
    <script>
        window.onload = function () {
            var chart = new CanvasJS.Chart("chartID", {
                exportEnabled: true,
                fillOpacity: .6,
                title:{
                    text: "Temperature of all months in Pune 2023"
                },
                axisY: {
                    title: "Temperature (in Celsius)"
                },
                axisX: {
                        valueFormatString: "MMM YY"
                },
                data: [
                {
                    type: "rangeSplineArea",
                    xValueFormatString: "MMM YY",
                    indexLabel: "{y[#index]}",
                    color: "lightblue",
                    markerSize: 8,
                    markerType: "cross",
                    markerColor: "blue",
                    lineColor: "gray",
                    lineThickness: 5,
                    dataPoints: [
                        { x: new Date(2023,00,01), y:[12, 22] },
                        { x: new Date(2023,01,01), y:[14, 24] },
                        { x: new Date(2023,02,01), y:[16, 28] },
                        { x: new Date(2023,03,01), y:[18, 30] },
                        { x: new Date(2023,04,01), y:[19, 31] },
                        { x: new Date(2023,05,01), y:[20, 33] },
                        { x: new Date(2023,06,01), y:[22, 33] },
                        { x: new Date(2023,07,01), y:[23, 34] },

                        { x: new Date(2023,08,01), y:[25, 32] },
                        { x: new Date(2023,09,01), y:[24, 30] },
                        { x: new Date(2023,10,01), y:[23, 28] },
                        { x: new Date(2023,11,01), y:[22, 26] },

                    ]// datapoints
               }]// end data
           });// canvas chart
          // Render chart in the HTML div
           chart.render();
        }// window onload
    </script>
</body>
</html>
输出:

结论: 每当我们需要强调一段时间内低值和高值之间的差异时,我们使用一组数据点创建范围图表。普通的范围图表填充了每个数据点之间的顶部值和底部值之间的区域。开发人员可以选择不同的变化或类型。
 极客教程
极客教程