如何使用CanvasJS实现多个数据序列图表
在本文中,我们将学习使用Canvas JS插件实现多个数据序列图表。
多系列图表可以轻松可视化多个数据系列,而无需使用额外的图表。当我们分析以不同比例和单位测量的数据系列时,它非常有用,并允许我们在同一图表上比较两个不相似的数据系列。它们可用于绘制多个需要使用曲线拟合的数据类别的数据。
使用Canvas JS插件,我们可以将多个dataSeries元素添加到一个数据数组中,以创建多系列图表。我们必须使用数据点的 type 属性来定义要渲染的图表。数据点的 type 属性可以取值为“column”、“line”、“area”、“bar”、“bubble”、“stackedArea”、“stackedColumn”等。
注意: “饼图”或“环图”只能有一个系列。
语法:
new CanvasJS.Chart($("#ID"), {
  data: [{
      type: "column",
      dataPoints: [
        {...},
    ]
   },
   {
     type: "column",
     dataPoints: [
       { ... }
     ]
   }
  ]
  ....
});
注意: type属性根据开发者的需求而更改。
方法:
- 从上述属性中选择一个多系列图表类型来实现。
- 在HTML设计中,使用
<div>标签来显示选择的图表。 - 在代码的script部分,通过使用语法设置CanvasJS库的type、data、datapoints和其他选项属性来实例化CanvasJS对象。
- 在代码的head部分包含CDN链接,以便使用插件的功能。
- 使用Canvas JS插件的render()方法渲染图表。
- 根据需要设置其他属性或样式,如以下示例代码中所示。
- 根据可用的数据进行代码实现。
CDN链接:
<script src="https://canvasjs.com/assets/script/canvasjs.min.js"></script>
示例 1:
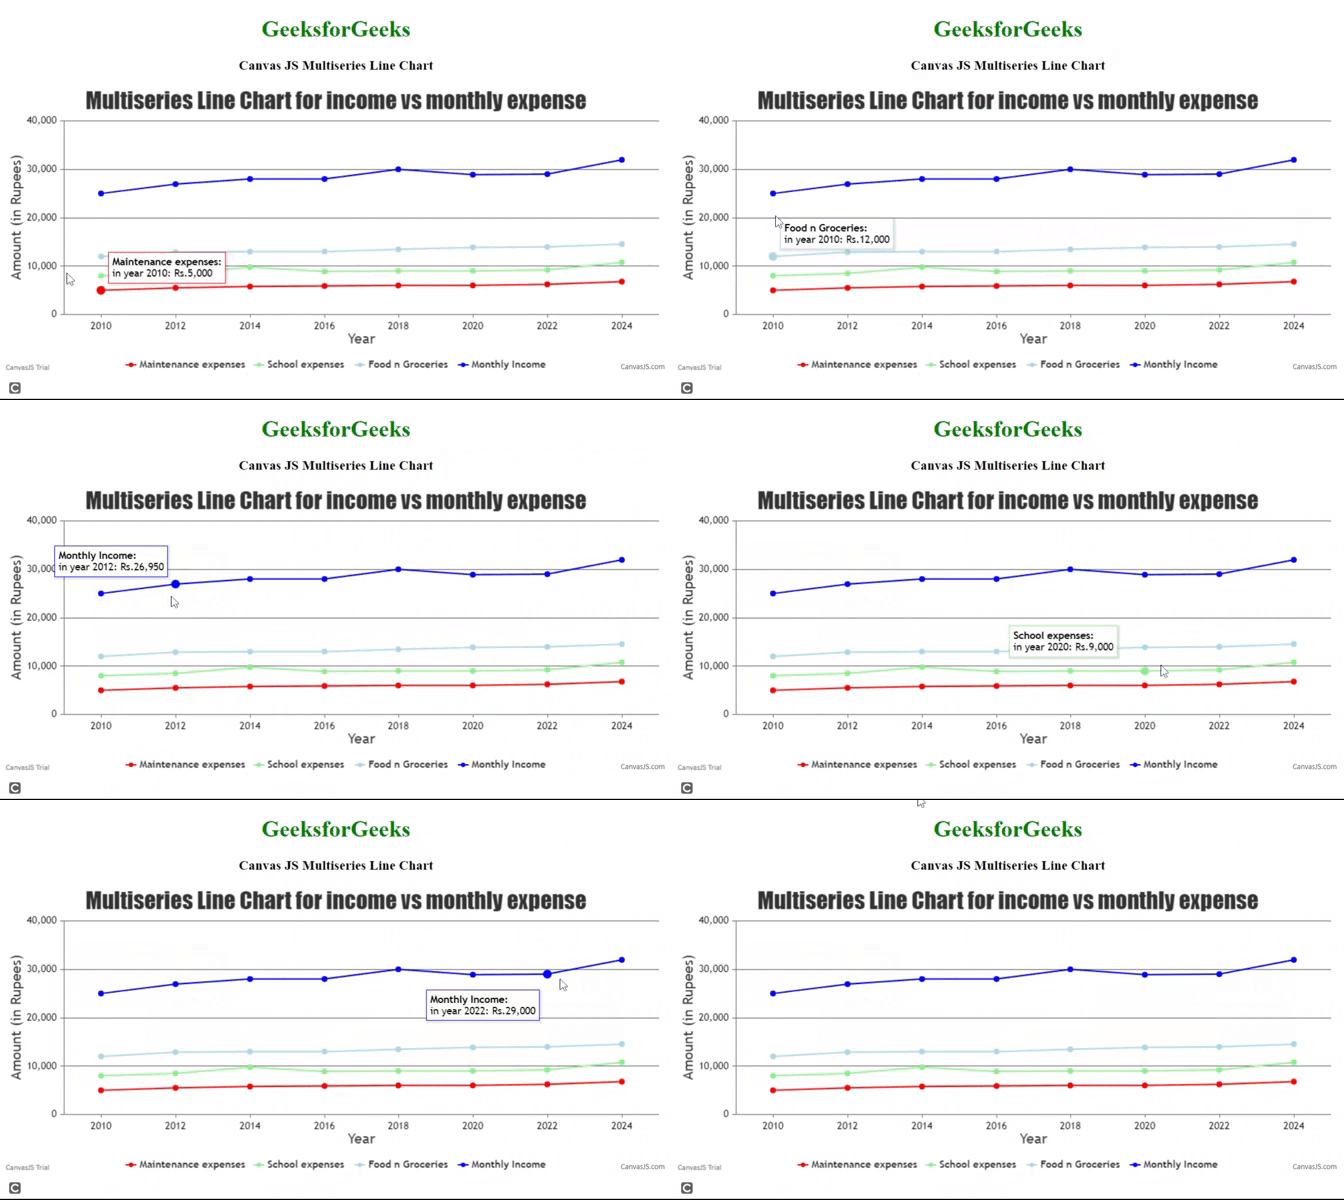
以下代码演示使用Canvas JS插件的多系列折线图。该图显示了多年来各个月份家庭支出和收入(y轴)的变化情况(x轴)。不同颜色的线表示不同类别的支出,如食物、维护、学校等。请参考输出并将鼠标悬停在上面以更好地理解。
HTML
<!DOCTYPE HTML>
<html>
<head>
    <script type="text/javascript"
            src="https://canvasjs.com/assets/script/canvasjs.min.js">
    </script>
</head>
<body>
    <div style="text-align:center">
        <h1 style="color:green">GeeksforGeeks</h1>
        <h3>Canvas JS Multiseries Line Chart </h3>
    </div>
    <div id="chartID" style="height:400px; max-width:950px;
            margin:0px auto;">
    </div>
    <script>
        window.onload = function () {
            var chart = new CanvasJS.Chart("chartID", {

                title: {
                    text:
                        "Multiseries Line Chart for income vs monthly expense"
                },
                axisX: {
                    title: "Year",

                },
                axisY: {
                    title: "Amount (in Rupees)",
                    Prefix: " Rs."
                },

                data: [
                    {
                        type: "line",
                        showInLegend: true,
                        name: "Maintenance expenses",
                        color: "red",
                        toolTipContent:
                            "<b>{name}:</b><br>in year {label}: Rs.{y}",
                        dataPoints: [
                            { label: "2010", y: 5000 },
                            { label: "2012", y: 5500 },
                            { label: "2014", y: 5789 },
                            { label: "2016", y: 5890 },
                            { label: "2018", y: 5998 },
                            { label: "2020", y: 6000 },
                            { label: "2022", y: 6235 },
                            { label: "2024", y: 6789 }

                        ]// end dataPoints
                    },
                    {
                        type: "line",
                        showInLegend: true,
                        name: "School expenses",
                        color: "lightgreen",
                        toolTipContent:
                            "<b>{name}:</b><br>in year {label}: Rs.{y}",
                        dataPoints: [
                            { label: "2010", y: 8000 },
                            { label: "2012", y: 8500 },
                            { label: "2014", y: 9789 },
                            { label: "2016", y: 8900 },
                            { label: "2018", y: 8998 },
                            { label: "2020", y: 9000 },
                            { label: "2022", y: 9235 },
                            { label: "2024", y: 10789 }

                        ]// end dataPoints

                    },
                    {
                        type: "line",
                        showInLegend: true,
                        name: "Food n Groceries",
                        toolTipContent:
                            "<b>{name}:</b><br>in year {label}: Rs.{y}",
                        color: "lightblue",
                        dataPoints: [
                            { label: "2010", y: 12000 },
                            { label: "2012", y: 12879 },
                            { label: "2014", y: 12999 },
                            { label: "2016", y: 13005 },
                            { label: "2018", y: 13456 },
                            { label: "2020", y: 13879 },
                            { label: "2022", y: 14000 },
                            { label: "2024", y: 14550 }

                        ]// end dataPoints
                    },
                    {
                        type: "line",
                        color: "blue",
                        showInLegend: true,
                        name: "Monthly Income",
                        toolTipContent:
                            "<b>{name}:</b><br>in year {label}: Rs.{y}",
                        dataPoints: [
                            { label: "2010", y: 25000 },
                            { label: "2012", y: 26950 },
                            { label: "2014", y: 27999 },
                            { label: "2016", y: 28000 },
                            { label: "2018", y: 29999 },
                            { label: "2020", y: 28890 },
                            { label: "2022", y: 29000 },
                            { label: "2024", y: 31950 }

                        ]// end dataPoints
                    }
                ]// end data
            });
            chart.render();
        }// window onload
    </script>
</body>
</html>
输出:

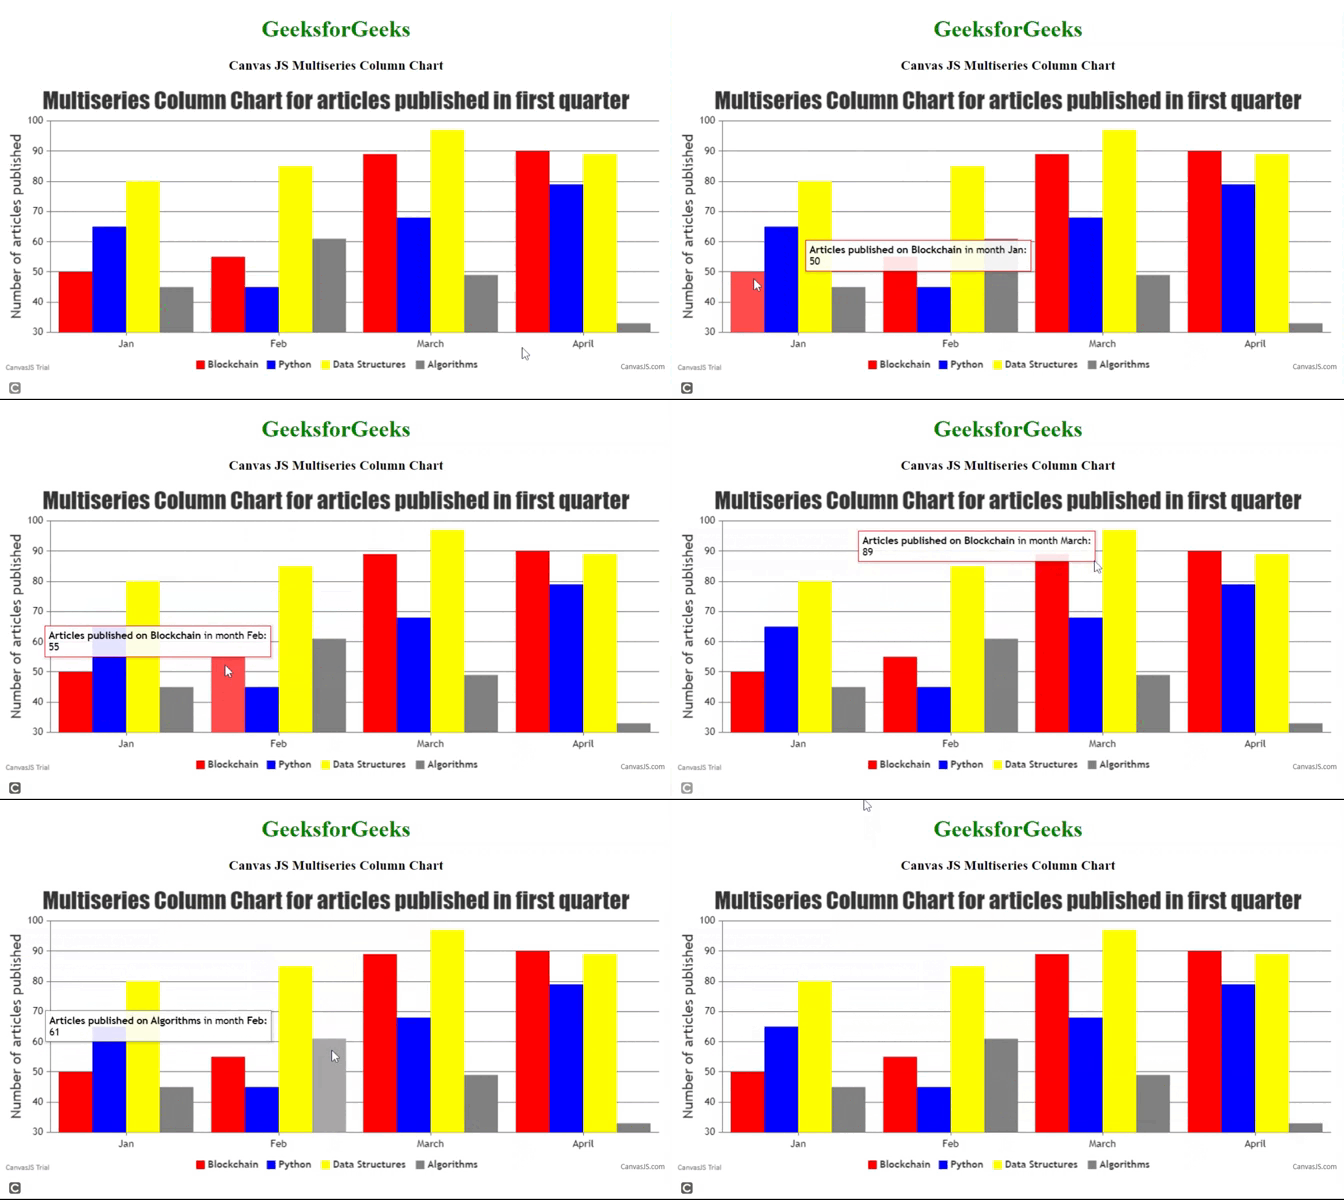
示例2: 以下代码演示使用Canvas JS插件的多系列柱状图。该图显示了一季度(x轴)中基于不同技术发布的文章数量(y轴)。不同颜色的柱子代表不同的技术,如“区块链”、“Python”、“数据结构”和“算法”。
HTML
<!DOCTYPE HTML>
<html>
<head>
    <script type="text/javascript" src=
"https://canvasjs.com/assets/script/canvasjs.min.js">
    </script>
</head>
<body>
    <div style="text-align:center">
        <h1 style="color:green">GeeksforGeeks</h1>
        <h3>Canvas JS Multiseries Column Chart </h3>
    </div>
    <div id="chartID"
         style="height:400px; max-width:950px;
            margin:0px auto;">
    </div>
    <script>
        window.onload = function () {
            var chart = new CanvasJS.Chart("chartID", {

                title:{
                    text:
        "Multiseries Column Chart for articles published in first quarter"
                },

                axisY:{
                    title: "Number of articles published"
                },

                data: [
                {
                    type: "column",
                    showInLegend: true,
                    name:"Blockchain",
                    color:"red",
                    toolTipContent:
        "<b>Articles published on {name}</b> in month {label}:<br> {y}",
                    dataPoints: [
                        { label:"Jan", y:50 },
                        { label:"Feb", y:55},
                        { label:"March", y:89},
                        { label: "April", y:90}

                    ]// end dataPoints
                },
                {
                    type: "column",
                    showInLegend: true,
                    name:"Python",
                    color:"blue",
                    toolTipContent:
        "<b>Articles published on {name}</b> in month <b> {label}:</b><br> {y}",
                    dataPoints: [
                        { label:"Jan", y:65 },
                        { label:"Feb", y:45},
                        { label:"March", y:68},
                        { label: "April", y:79}
                    ]// end dataPoints
                },
                {
                    type: "column",
                    showInLegend: true,
                    name: "Data Structures",
                    color:"yellow",
                    toolTipContent:
        "<b>Articles published on {name}</b> in month <b>{label}:</b><br> {y}",
                    dataPoints: [
                        { label:"Jan", y:80},
                        { label:"Feb", y:85 },
                        { label:"March", y:97},
                        { label: "April", y:89}
                    ]// end dataPoints
                },
                {
                    type: "column",
                    showInLegend: true,
                    name:"Algorithms",
                    toolTipContent:
        "<b>Articles published on {name}</b> in month <b>{label}:</b><br> {y}",
                    color:"grey",
                    dataPoints: [
                        { label:"Jan", y:45},
                        { label:"Feb", y:61 },
                        { label:"March", y:49},
                        { label: "April", y:33}

                    ]// end dataPoints
                }
                ]// end data
            });
            chart.render();
        }// window onload
    </script>
</body>
</html>
输出:

结论: 每当我们需要在多个类别上显示图表而不使用额外的类别时,我们需要使用多系列数据图表。它用于分析和比较一次分组在子类别中的数据点。
 极客教程
极客教程