Angular PrimeNG BarChart多轴图
Angular PrimeNG是一个开源框架,它有丰富的原生Angular UI组件,可以用来做很好的造型,这个框架用来做响应式网站非常方便。在这篇文章中,我们将看到Angular PrimeNG中的BarChart Multi Axis。
柱状图或条形图是一种以矩形柱状形式表示分组数据的图表,其长度与它们所代表的值成正比。在多轴条形图中,可以使用属性AxisID.为数据集分配一个自定义的轴。
创建Angular应用程序和模块安装。
第1步:使用以下命令创建一个Angular应用程序。
ng new appname
第2步:在创建你的项目文件夹即appname后,使用以下命令移动到它。
cd appname
第3步:在你给定的目录中安装PrimeNG。
npm install primeng --save
npm install primeicons --save
npm install chart.js --save
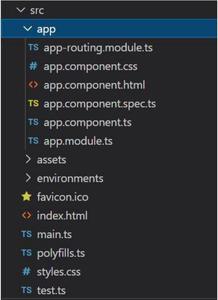
项目结构:它将看起来像如下。
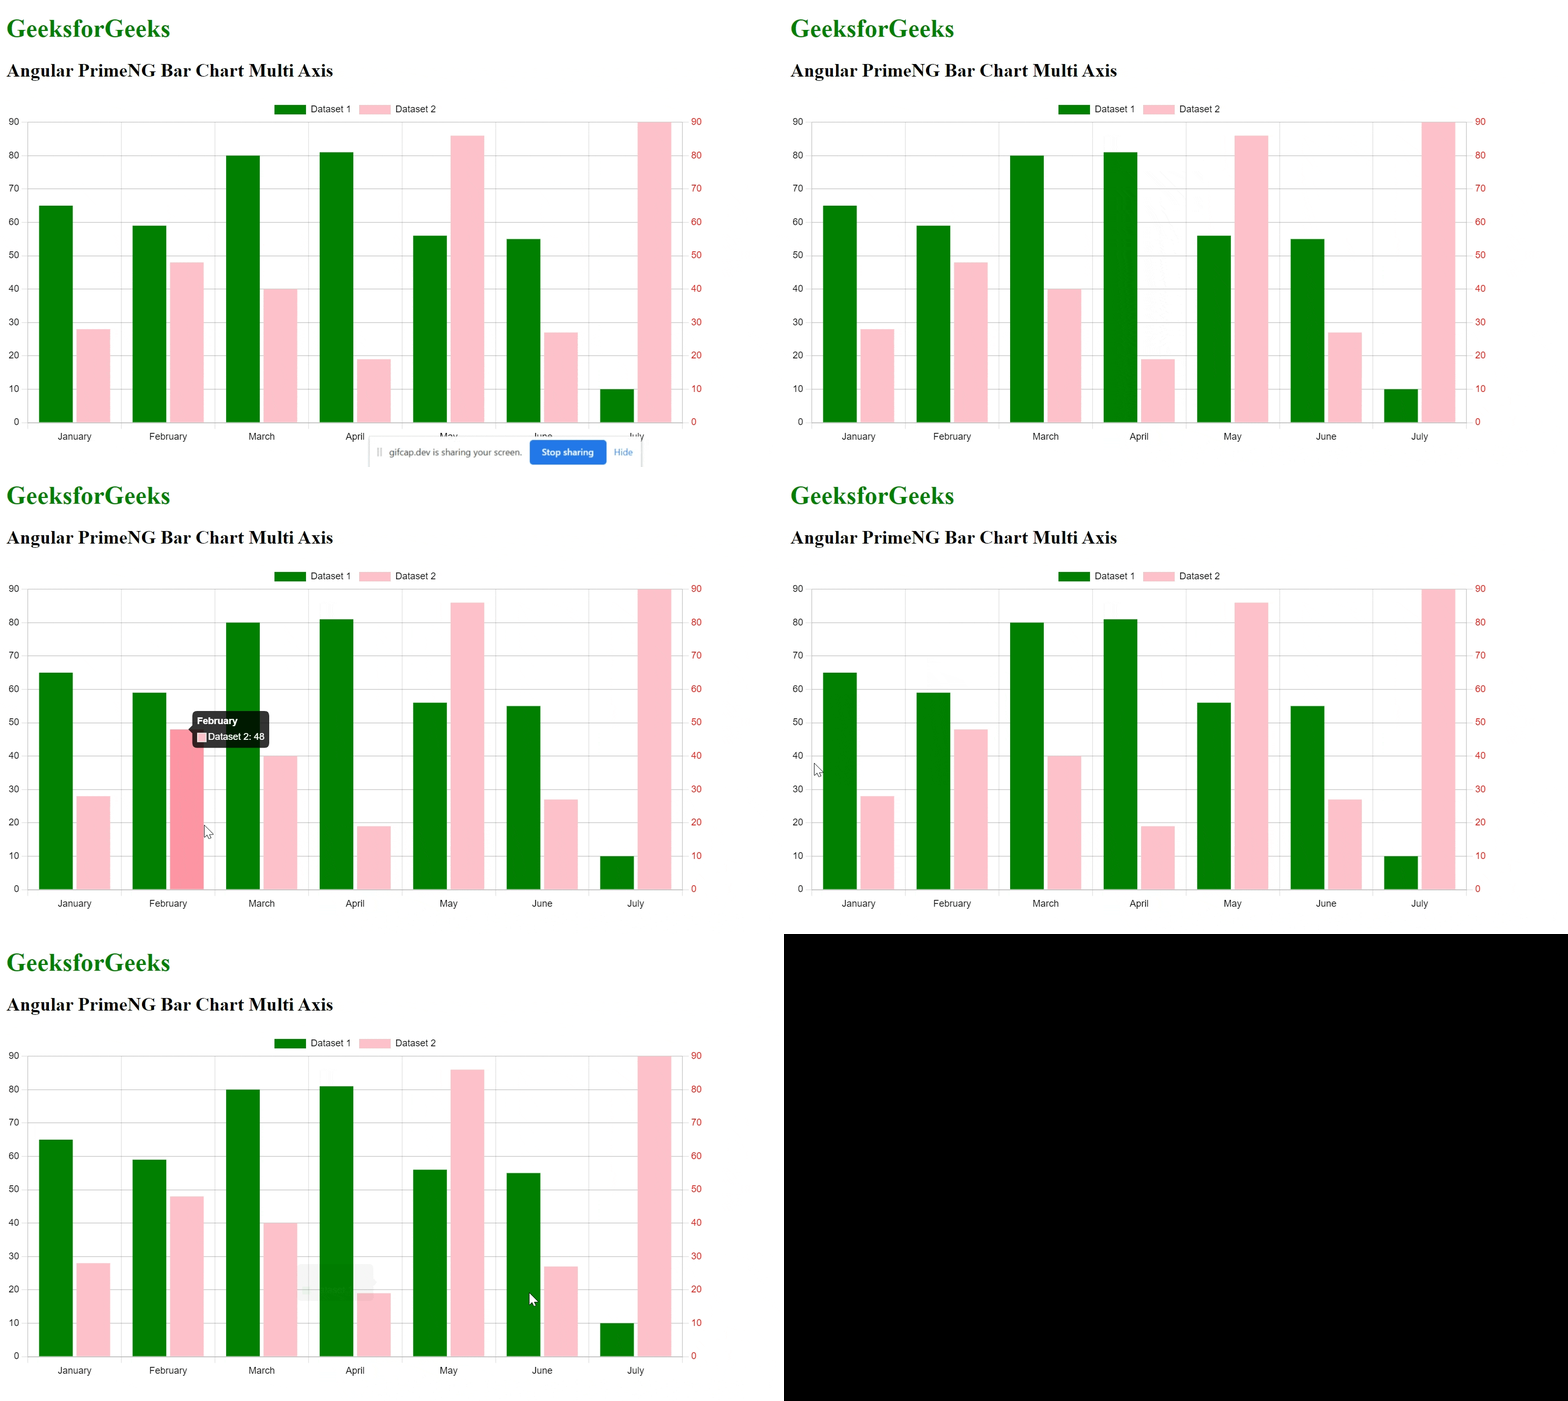
例子1:这个例子描述了Angular PrimeNG中BarChart多轴的基本用法。在这里,我们将为数据集1提供‘y’轴,为数据集2提供‘y1’轴。
- app.component.html
<div id="GFG">
    <h1 style="color:green">GeeksforGeeks</h1>
    <h2>Angular PrimeNG Bar Chart Multi Axis</h2>
    <div style="width:70%;">
        <p-chart type="bar"
                 [data]="basicData"
                 [options]="multiAxisOptions">
        </p-chart>
    </div>
</div>
- app.component.ts
import { Component } from '@angular/core';

@Component({
    selector: 'app-root',
    templateUrl: './app.component.html',
    styleUrls: ['./app.component.css']
})
export class AppComponent {
    title = 'GFG';
    basicData = {
        labels: ['January', 'February', 'March',
                 'April', 'May', 'June', 'July'],
        datasets: [{
            label: 'Dataset 1',
            backgroundColor: 'green',
            yAxisID: 'y',
            data: [65, 59, 80, 81, 56, 55, 10]
        }, {
            label: 'Dataset 2',
            backgroundColor: 'pink',
            yAxisID: 'y1',
            data: [28, 48, 40, 19, 86, 27, 90]
        }]
    }

    multiAxisOptions = {
        plugins: {
            legend: {
                labels: {
                    color: '#black'
                }
            },
            tooltips: {
                mode: 'index',
                intersect: true
            }
        },
        scales: {
            x: {
                ticks: {
                    color: '#black'
                },

            },
            y: {
                type: 'linear',
                display: true,
                position: 'left',
                ticks: {
                    min: 0,
                    max: 100,
                    color: '#black'
                },

            },
            y1: {
                type: 'linear',
                display: true,
                position: 'right',

                ticks: {
                    min: 0,
                    max: 100,
                    color: 'red'
                }
            }
        }
    };
}
- app.module.ts
import { NgModule } from '@angular/core';
import { BrowserModule }
    from '@angular/platform-browser';
import { AppComponent } from './app.component';
import { ChartModule } from 'primeng/chart';

@NgModule({
    declarations: [
        AppComponent,
    ],
    imports: [
        BrowserModule,
        ChartModule
    ],
    providers: [],
    bootstrap: [AppComponent]
})
export class AppModule { }
输出:

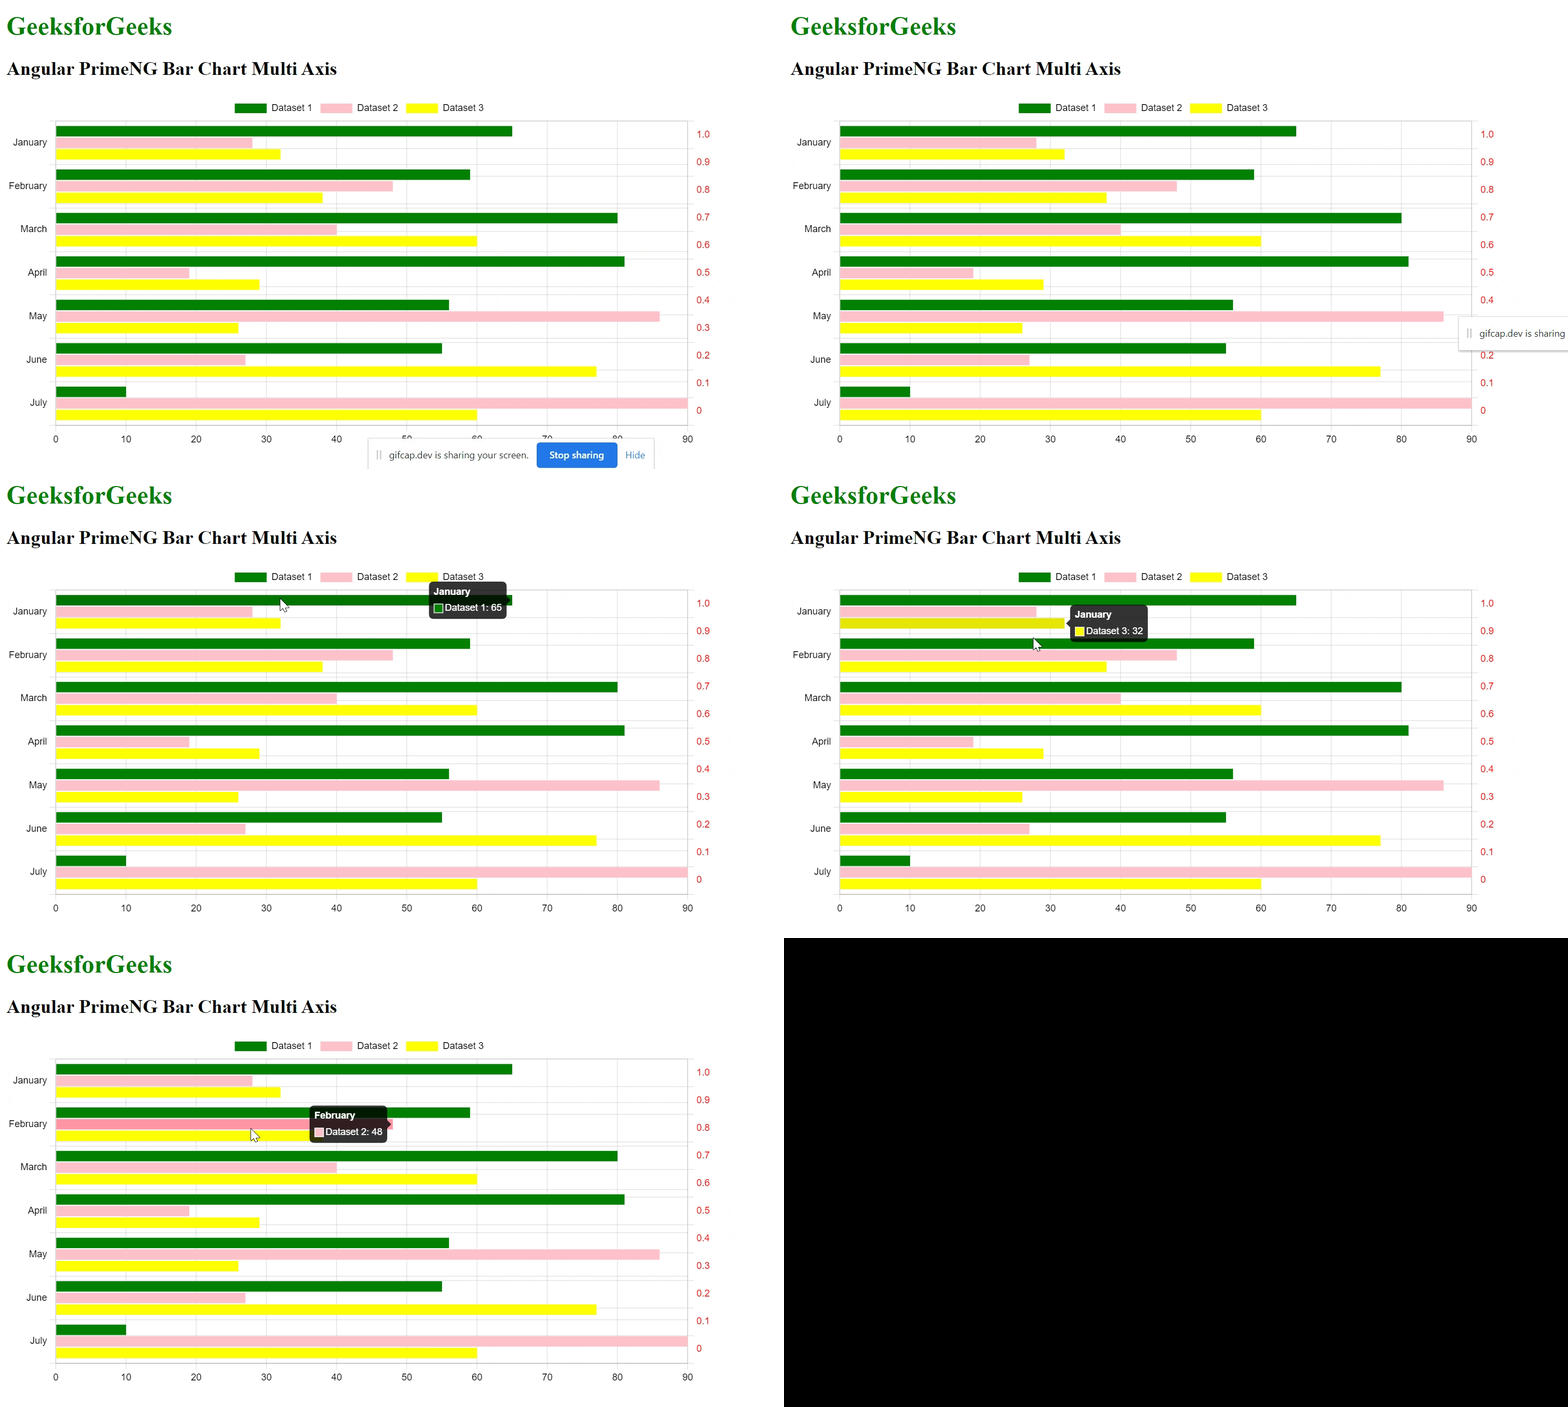
例子2:在这个例子中,我们将显示3个数据集,并使用indexAxis属性将方向改为垂直。
- app.component.html
<div id="GFG">
    <h1 style="color:green">GeeksforGeeks</h1>
    <h2>Angular PrimeNG Bar Chart Multi Axis</h2>
    <div style="width:70%;">
        <p-chart type="bar"
                 [data]="basicData"
                 [options]="multiAxisOptions">
        </p-chart>
    </div>
</div>
- app.component.ts
import { Component } from '@angular/core';

@Component({
    selector: 'app-root',
    templateUrl: './app.component.html',
    styleUrls: ['./app.component.css']
})
export class AppComponent {
    title = 'GFG';
    basicData = {
        labels: ['January', 'February', 'March',
                 'April', 'May', 'June', 'July'],
        datasets: [{
            label: 'Dataset 1',
            backgroundColor: 'green',
            AxisID: 'x',
            data: [65, 59, 80, 81, 56, 55, 10]
        }, {
            label: 'Dataset 2',
            backgroundColor: 'pink',
            AxisID: 'x1',
            data: [28, 48, 40, 19, 86, 27, 90]
        },
        {
            label: 'Dataset 3',
            backgroundColor: 'yellow',
            AxisID: 'x',
            data: [32, 38, 60, 29, 26, 77, 60]
        }
        ]
    }

    multiAxisOptions = {
        indexAxis: 'y',
        plugins: {
            legend: {
                labels: {
                    color: '#black'
                }
            },
            tooltips: {
                mode: 'index',
                intersect: true
            }
        },
        scales: {
            y: {
                ticks: {
                    color: '#black'
                },

            },
            x: {
                type: 'linear',
                display: true,
                position: 'left',
                ticks: {
                    min: 0,
                    max: 100,
                    color: '#black'
                },

            },
            x1: {
                type: 'linear',
                display: true,
                position: 'right',

                ticks: {
                    min: 0,
                    max: 100,
                    color: 'red'
                }
            }
        }
    };
}
- app.module.ts
import { NgModule } from '@angular/core';
import { BrowserModule }
    from '@angular/platform-browser';
import { AppComponent } from './app.component';
import { ChartModule } from 'primeng/chart';

@NgModule({
    declarations: [
        AppComponent,
    ],
    imports: [
        BrowserModule,
        ChartModule
    ],
    providers: [],
    bootstrap: [AppComponent]
})
export class AppModule { }
输出:

 极客教程
极客教程