使用Python对战争进行Twitter情绪分析
在这篇文章中,我们将看到如何使用Python对战争进行Twitter情感分析。
自从社交媒体开始受到关注以来,它在公共舆论中的作用是深刻而明显的。社交媒体让我们能够以巨大的能力和规模分享信息。就在俄乌可能开战的消息传出后,全球各地的网民开始涌向这个平台,发表他们的意见。对这些意见的分析可以帮助我们了解公众对战前和战时不同事件的想法。我们从2022年1月到3月的第一周,在推特上搜索与俄罗斯入侵乌克兰有关的关键词,如#乌克兰战争#俄罗斯入侵#与乌克兰站在一起#乌克兰北约等,目的是了解世界各地的人在这些事件中的情绪。
首先,为了分析情感和处理数据,我们需要导入以下依赖关系。
导入依赖
首先,我们将需要导入以下依赖关系。
# Import Libraries

from textblob import TextBlob
import sys
import matplotlib.pyplot as plt
import pandas as pd
import numpy as np
import os
import nltk
import re
import string
import seaborn as sns


from PIL import Image
from nltk.sentiment.vader import SentimentIntensityAnalyzer
from nltk.stem import SnowballStemmer
from nltk.sentiment.vader import SentimentIntensityAnalyzer
from sklearn.feature_extraction.text import CountVectorizer
数据集加载
战争65天的推文数据集可在此获得(kaggle数据集下载-d foklacu/ukrain-war-tweets-dataset-65-days)。它有从2022年1月1日至2022年3月6日的推文。这条时间线包括入侵前和入侵高峰期。这个数据集包含每天最多5000条推文,搜索关键词为 “乌克兰战争”、”乌克兰军队”、”乌克兰边境”、”乌克兰北约”、”StandwithUkraine”、”俄罗斯军队”、”俄罗斯边境乌克兰”、”俄罗斯入侵”。数据集根据搜索关键词被分为8个逗号分隔的数值(CSV)文件。这些文件使用Pandas Dataframe进行提取和加载。加载数据集的代码将是。
# The dataset consists of tweets from
# total 8 hashtags and present in
# separated csv files. All those csv files are loaded.
tweets=pd.read_csv("/dataset/Russia_invade.csv")
tweets=tweets.append(pd.read_csv("/Russian_border_Ukraine.csv"))
tweets=tweets.append(pd.read_csv("/Russian_troops.csv"))
tweets=tweets.append(pd.read_csv("/StandWithUkraine.csv"))
tweets=tweets.append(pd.read_csv("/Ukraine_border.csv"))
tweets=tweets.append(pd.read_csv("/Ukraine_nato.csv"))
tweets=tweets.append(pd.read_csv("/Ukraine_troops.csv"))
tweets=tweets.append(pd.read_csv("/Ukraine_war.csv"))
所以,在这里,我们已经将所有的8个CSV文件加载到一个Pandas数据框架中。
删除重复的内容
然后,最重要的是要从数据集中删除任何重复的推文。下面的代码可以帮助我们做到这一点。
tweets.drop_duplicates(inplace=True) # remove duplicates
预处理
存在于数据集中的日期列同时具有日期和时间。对于接下来的处理步骤,去除时间部分是有帮助的。下面的代码将有助于做到这一点。
# slicing the date , and removing the time portion
tweets['date'] = tweets.date.str.slice(0, 10)
现在,我们有61种不同语言的推文,共65天。为了检查这一点,我们可以使用以下代码 –
# checking all the unique dates in the dataset
print(tweets['date'].unique())

# checking how many unique language
# tweets are present in the dataset
print(tweets["lang"].unique())
输出:
['2022-03-05' '2022-03-04' '2022-03-03' '2022-03-02' '2022-03-01'
 '2022-02-28' '2022-02-27' '2022-02-26' '2022-02-25' '2022-02-24'
 '2022-02-23' '2022-02-22' '2022-02-21' '2022-02-20' '2022-02-19'
 '2022-02-18' '2022-02-17' '2022-02-16' '2022-02-15' '2022-02-14'
 '2022-02-13' '2022-02-12' '2022-02-11' '2022-02-10' '2022-02-09'
 '2022-02-08' '2022-02-07' '2022-02-06' '2022-02-05' '2022-02-04'
 '2022-02-03' '2022-02-02' '2022-02-01' '2022-01-31' '2022-01-30'
 '2022-01-29' '2022-01-28' '2022-01-27' '2022-01-26' '2022-01-25'
 '2022-01-24' '2022-01-23' '2022-01-22' '2022-01-21' '2022-01-20'
 '2022-01-19' '2022-01-18' '2022-01-17' '2022-01-16' '2022-01-15'
 '2022-01-14' '2022-01-13' '2022-01-12' '2022-01-11' '2022-01-10'
 '2022-01-09' '2022-01-08' '2022-01-07' '2022-01-06' '2022-01-05'
 '2022-01-04' '2022-01-03' '2022-01-02' '2022-01-01' '2021-12-31']
['en' 'pt' 'zh' 'nl' 'it' 'es' 'de' 'ca' 'cy' 'fr' 'tr' 'ro' 'pl' 'cs'
 'ja' 'in' 'hi' 'und' 'sv' 'tl' 'et' 'fi' 'da' 'no' 'el' 'ht' 'ru' 'ar'
 'ko' 'fa' 'sl' 'iw' 'dv' 'ta' 'lv' 'pa' 'eu' 'kn' 'ur' 'bn' 'gu' 'uk'
 'ne' 'ml' 'sd' 'hu' 'lt' 'my' 'vi' 'te' 'th' 'ka' 'is' 'sr' 'bg' 'am'
 'mr' 'si' 'km' 'or' 'ps']
现在我们将只取英文推文,并删除所有非英文推文。下面的代码片段将帮助我们做到这一点。
# before removing the non-english tweets
print(tweets.shape)

# removing all the tweets expect the
# non-english tweets
tweets = tweets[tweets['lang'] == 'en']
print("After removing non-english Tweets")

# only the number of english tweets
print(tweets.shape)
输出:
(1313818, 29)
After removing non-english Tweets
(1204218, 29)
在这里,我们可以发现早些时候我们有1313818条推文,在去除非英语推文后,我们有1204218条推文。
接下来,标点符号、标签和注释被删除,所有文本被转换为小写字母,以避免相同词语的重复。
# Removing RT, Punctuation etc
def remove_rt(x): return re.sub('RT @\w+: ', " ", x)

def rt(x): return re.sub(
    "(@[A-Za-z0-9]+)|([^0-9A-Za-z \t])|(\w+:\/\/\S+)", " ", x)

tweets["content"] = tweets.content.map(remove_rt).map(rt)
tweets["content"] = tweets.content.str.lower()
这种操作前后的文本比较——。

情绪分析
情感分析程序包括收集数据、分析数据、预处理数据,然后进行情感识别、特征选择、情感分类,以及去除其中的极性和主观性。TextBlob库被用来分析推文的情绪。一条推文的负面分数大于正面分数,如果相反则标记为正面,否则标记为负面,否则为中性。移除样本数据集中每一个独特日子的推文数量,然后计算该日有正面、负面和中性推文的数量,找出它们的百分比。这有助于我们了解人们在一天中的反应。以下是相关的代码片段
tweets[['polarity', 'subjectivity']] = tweets['content'].apply(
    lambda Text: pd.Series(TextBlob(Text).sentiment))

for index, row in tweets['content'].iteritems():
    score = SentimentIntensityAnalyzer().polarity_scores(row)
    neg = score['neg']
    neu = score['neu']
    pos = score['pos']
    comp = score['compound']

    if neg > pos:
        tweets.loc[index, 'sentiment'] = "negative"
    elif pos > neg:
        tweets.loc[index, 'sentiment'] = "positive"
    else:
        tweets.loc[index, 'sentiment'] = "neutral"

    tweets.loc[index, 'neg'] = neg
    tweets.loc[index, 'neu'] = neu
    tweets.loc[index, 'pos'] = pos
    tweets.loc[index, 'compound'] = comp
现在,如果我们想看到上述操作的结果,那么我们可以使用以下代码片段。
tweets[["content", "sentiment", "polarity",
        "subjectivity", "neg", "neu", "pos"]].head(5)
输出:

现在,为了计算正面、负面和中立推文的总百分比,我们将使用以下代码片段。
total_pos = len(tweets.loc[tweets['sentiment'] == "positive"])
total_neg = len(tweets.loc[tweets['sentiment'] == "negative"])
total_neu = len(tweets.loc[tweets['sentiment'] == "neutral"])
total_tweets = len(tweets)
print("Total Positive Tweets % : {:.2f}"
      .format((total_pos/total_tweets)*100))
print("Total Negative Tweets % : {:.2f}"
      .format((total_neg/total_tweets)*100))
print("Total Neutral Tweets % : {:.2f}"
      .format((total_neu/total_tweets)*100))
输出:
Total Positive Tweets % : 31.24
Total Negative Tweets % : 54.97
Total Neutral Tweets % : 13.79
如果我们想用饼状图来显示这个结果,那么我们可以借助下面的代码段来实现 —
mylabels = ["Positive", "Negative", "Neutral"]
mycolors = ["Green", "Red", "Blue"]

plt.figure(figsize=(8, 5),
           dpi=600)  # Push new figure on stack
myexplode = [0, 0.2, 0]
plt.pie([total_pos, total_neg, total_neu], colors=mycolors,
        labels=mylabels, explode=myexplode)
plt.show()
输出:
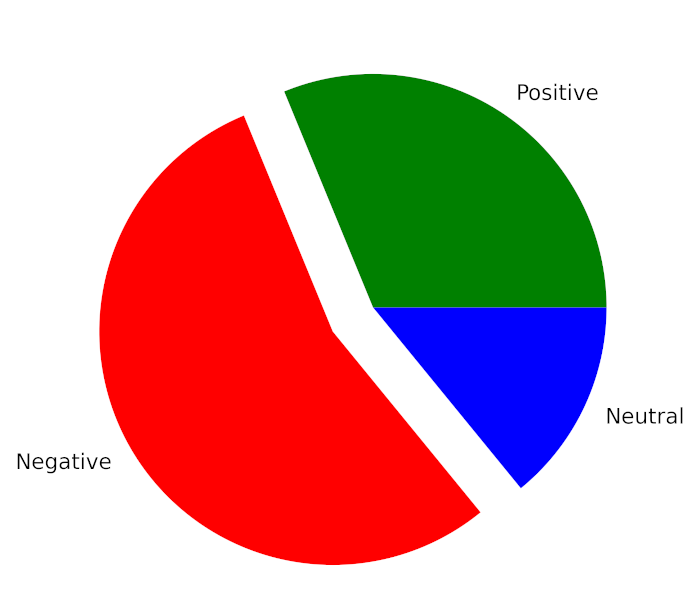
现在,如果我们想看到65天的情绪,那么我们可以借助下面的代码段来实现。
pos_list = []
neg_list = []
neu_list = []
for i in tweets["date"].unique():
    temp = tweets[tweets["date"] == i]
    positive_temp = temp[temp["sentiment"] == "positive"]
    negative_temp = temp[temp["sentiment"] == "negative"]
    neutral_temp = temp[temp["sentiment"] == "neutral"]
    pos_list.append(((positive_temp.shape[0]/temp.shape[0])*100, i))
    neg_list.append(((negative_temp.shape[0]/temp.shape[0])*100, i))
    neu_list.append(((neutral_temp.shape[0]/temp.shape[0])*100, i))

neu_list = sorted(neu_list, key=lambda x: x[1])
pos_list = sorted(pos_list, key=lambda x: x[1])
neg_list = sorted(neg_list, key=lambda x: x[1])

x_cord_neg = []
y_cord_neg = []

x_cord_pos = []
y_cord_pos = []

x_cord_neu = []
y_cord_neu = []

for i in neg_list:
    x_cord_neg.append(i[0])
    y_cord_neg.append(i[1])


for i in pos_list:
    x_cord_pos.append(i[0])
    y_cord_pos.append(i[1])

for i in neu_list:
    x_cord_neu.append(i[0])
    y_cord_neu.append(i[1])


plt.figure(figsize=(16, 9),
           dpi=600)  # Push new figure on stack
plt.plot(y_cord_neg, x_cord_neg, label="negative",
         color="red")
plt.plot(y_cord_pos, x_cord_pos, label="positive",
         color="green")
plt.plot(y_cord_neu, x_cord_neu, label="neutral",
         color="blue")
plt.xticks(np.arange(0, len(tweets["date"].unique()) + 1, 5))
plt.xticks(rotation=90)
plt.grid(axis='x')

plt.legend()
输出:
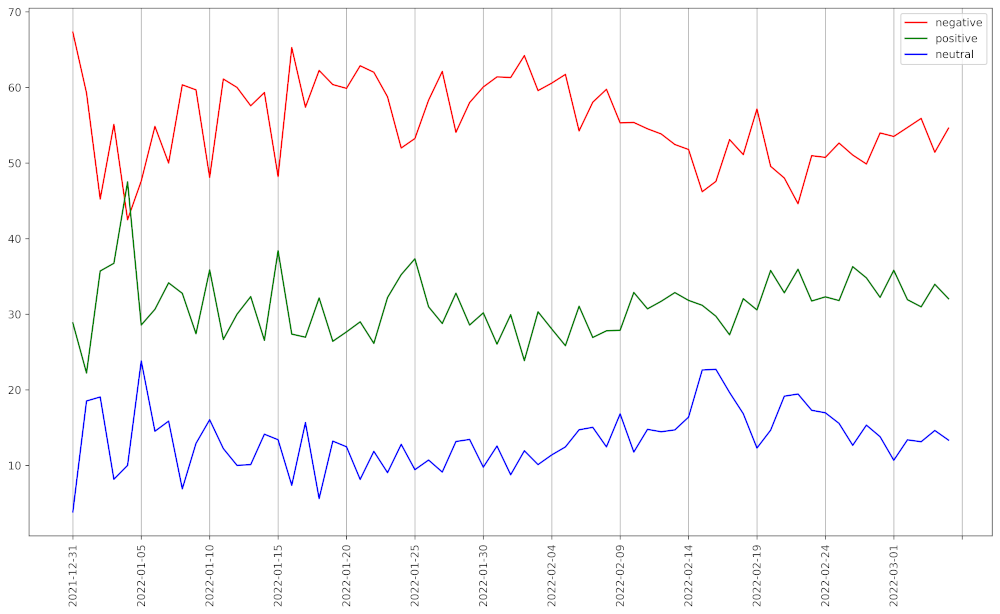
推文的情感以图表形式呈现
使用N-gram的词汇流行度
我们使用Scikit-Learn的特征提取模块来找出最流行的词和一组相邻的词。在这里,我们得到了一个经过标记化、去除停顿词和对先前清理过的文本进行词根处理的词袋模型。下面是相同的代码片段—-。
# Removing Punctuation
def remove_punct(text):
    text = "".join([char for char in text if
                    char not in string.punctuation])
    text = re.sub('[0-9]+', '', text)
    return text


tw_list['punct'] = tw_list['content'].apply(
  lambda x: remove_punct(x))

# Applying tokenization
def tokenization(text):
    text = re.split('\W+', text)
    return text


tw_list['tokenized'] = tw_list['punct'].apply(
    lambda x: tokenization(x.lower()))

# Removing stopwords
stopword = nltk.corpus.stopwords.words('english')

def remove_stopwords(text):
    text = [word for word in text if
            word not in stopword]
    return text

tw_list['nonstop'] = tw_list['tokenized'].apply(
  lambda x: remove_stopwords(x))

# Applying Stemmer
ps = nltk.PorterStemmer()

def stemming(text):
    text = [ps.stem(word) for word in text]
    return text

tw_list['stemmed'] = tw_list['nonstop'].apply(
  lambda x: stemming(x))

tw_list.head()
输出:

为了从中找出最常用的词,我们首先需要一个词袋。词袋是一个矩阵,每一行代表一个特定的文本,每一列代表词汇中的一个词。然后生成一个包含所有文本中每个词出现次数之和的向量。换句话说,”词袋 “矩阵每一列的元素都要加起来。最后,对带有单词和其出现次数的列表进行排序。以下是代码片段
# Applying Countvectorizer
countVectorizer = CountVectorizer(analyzer=clean_text)
countVector = countVectorizer.fit_transform(tw_list['content'])
count_vect_df = pd.DataFrame(
    countVector.toarray(),
  columns=countVectorizer.get_feature_names())
count_vect_df.head()

# Most Used Words
count = pd.DataFrame(count_vect_df.sum())
countdf = count.sort_values(0,
                            ascending=False).head(20)
countdf[1:11]
输出:
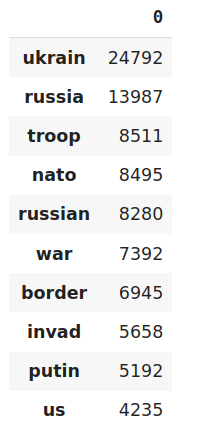
使用最多的词
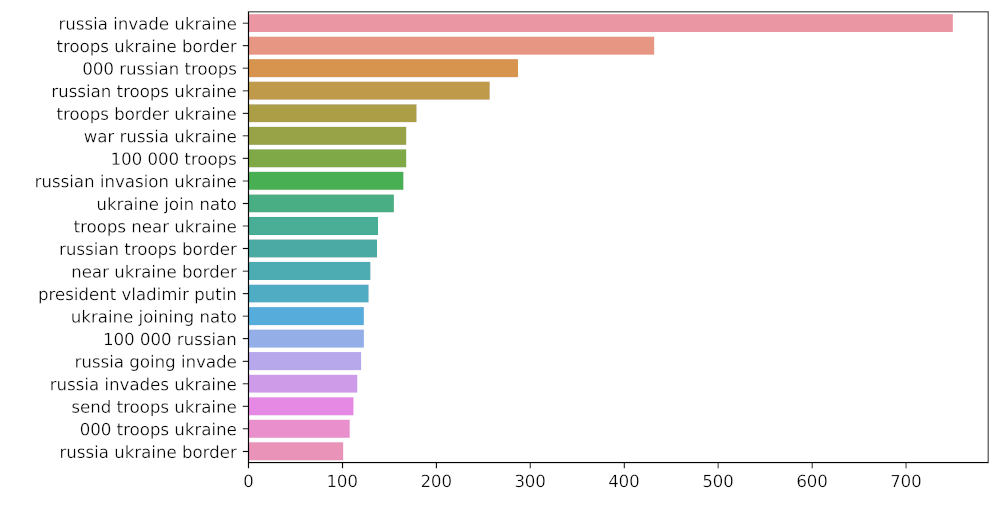
现在,为了找出相邻单词的组别,我们将借助Unigram和Bigram的帮助。以下是相关的代码片段。
# Function to ngram
def get_top_n_gram(corpus, ngram_range, n=None):
    vec = CountVectorizer(ngram_range=ngram_range,
                          stop_words='english').fit(corpus)
    bag_of_words = vec.transform(corpus)
    sum_words = bag_of_words.sum(axis=0)
    words_freq = [(word, sum_words[0, idx])
                  for word, idx in vec.vocabulary_.items()]
    words_freq = sorted(words_freq, key=lambda x: x[1], reverse=True)
    return words_freq[:n]

# n2_bigram
n2_bigrams = get_top_n_gram(tw_list['content'], (2, 2), 20)
plt.figure(figsize=(8, 5),
           dpi=600)  # Push new figure on stack

sns_plot = sns.barplot(x=1, y=0, data=pd.DataFrame(n2_bigrams))
plt.savefig('bigram.jpg')  # Save that figure

# n3_trigram
n3_trigrams = get_top_n_gram(tw_list['content'], (3, 3), 20)

plt.figure(figsize=(8, 5),
           dpi=600)  # Push new figure on stack

sns_plot = sns.barplot(x=1, y=0, data=pd.DataFrame(n3_trigrams))
plt.savefig('trigram.jpg')  # Save that figure
输出:
大图表示法
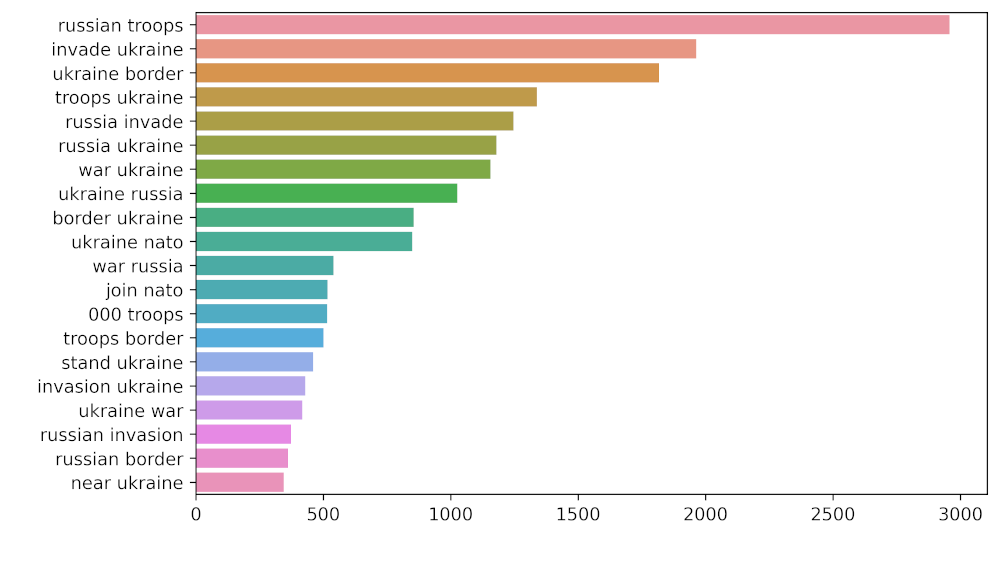
三角形表示法
 极客教程
极客教程