模拟随机时间点做交易,上一篇中,我们尝试了一种交易策略。但是因为没有测试基准,我们很难对这种交易策略的效果进行评价。这种情况下,通常会假设我们能“击败”随机过程,把在随机时间点做交易作为测试基准。我们将要模拟的是,从一年所有的交易日中,随机抽取若干日进行交易。这将展示NumPy中随机数的使用。
准备工作
如有必要,请先安装Matplotlib。
具体步骤
首先,我们需要一个由随机整数构成的数组。
- 生成随机索引。
使用NumPy的randint函数,生成随机整数。从全年交易日中随机选取若干日时,将要用到这个函数。
return numpy.random.randint(0, high, size)
- 模拟交易过程。
模拟交易过程,需要用到上一步骤获得的随机索引。使用NumPy的take函数,从收盘价数组中随机选取若干元素。
buys = numpy.take(close, get_indices(len(close), nbuys))
sells = numpy.take(close, get_indices(len(close), nbuys))
profits[i] = sells.sum() - buys.sum()
- 绘制利润直方图。
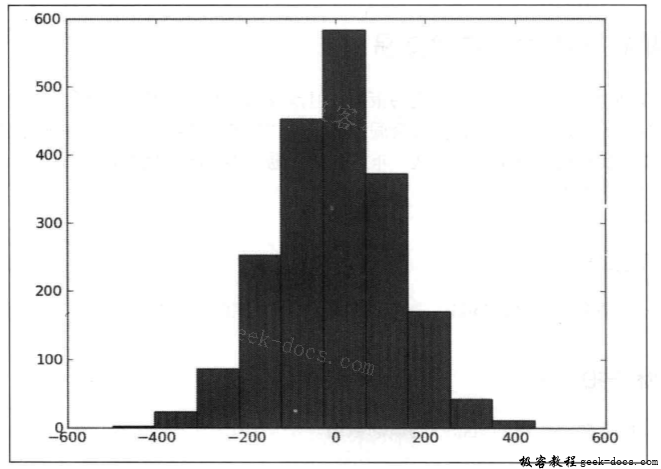
进行很多次模拟后,绘制利润直方图。
matplotlib.pyplot.hist(profits)
matplotlib.pyplot.show()
假设使用AAPL股票的交易数据,一年买卖五次,进行2000次模拟后,得到如下的直方图。

本攻略的完整代码如下。
from matplotlib.finance import quotes_historical_yahoo
from datetime import date
import numpy
import sys
import matplotlib.pyplot

def get_indices(high, size):
    #2. 生成随机索引
    return numpy.random.randint(0, high, size)

#1. 获取收盘价
today = date.today()
start = (today.year - 1, today.month, today.day)

quotes = quotes_historical_yahoo(sys.argv[1], start, today)
close =  numpy.array([q[4] for q in quotes])

nbuys = int(sys.argv[2])
N = int(sys.argv[3])
profits = numpy.zeros(N)

for i in xrange(N):
   #3. 模拟交易过程
   buys = numpy.take(close, get_indices(len(close), nbuys))
   sells = numpy.take(close, get_indices(len(close), nbuys))
   profits[i] = sells.sum() - buys.sum()

print "Mean", profits.mean()
print "Std", profits.std()

#4. 绘制利润直方图
matplotlib.pyplot.hist(profits)
matplotlib.pyplot.show()

#python random_periodic.py AAPL 5 2000
#Mean -2.566465
#Std 133.746039463
小结
我们用到了numpy.random模块中的randint函数。numpy.random模块中还包含了更多方便易用的随机数生成器,这些函数的功能描述如下。
| 函数 | 功能描述 |
|---|---|
rand |
根据维度参数生成指定形状的数组。数组元素是一个随机数,符合[0,1]区间上的均匀分布。如果没有指定维度参数,则返回一个浮点数 |
randn |
数组元素是来自一个均值为0、方差为1的正态分布的采样值。维度参数的作用同rand |
randint |
给定一个下边界、一个可选的上边界和一个可选的输出形状,返回一个整数数组 |
 极客教程
极客教程