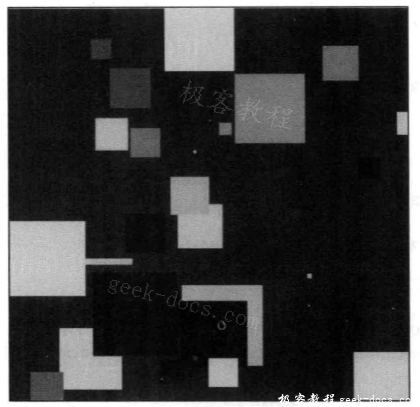
建议把大文件加载到内存映射区。内存映射文件只加载大文件的一小部分。NumPy的内存映射是类数组结构。本例中,我们将生成一幅由若干彩色小方块构成的图像并将其加载到内存映射区。
准备工作
如有必要,请先安装Matplotlib。
具体步骤
我们将从初始化数组开始介绍。
- 初始化数组。
首先对如下的数组进行初始化。
- 用于保存图像数据的数组
- 用于存放随机生成的小方块中心点坐标的数组
- 用于存放随机生成的小方块半边长的数组
- 用于存放随机生成的小方块颜色的数组
数组的初始化代码如下。
img = numpy.zeros((N, N), numpy.uint8)
centers = numpy.random.random_integers
    (0, N, size=(NSQUARES, 2))
radii = numpy.random.randint
    (0, N/9, size=NSQUARES)
colors = numpy.random.randint
    (100, 255, size=NSQUARES)
如你所见,第一个数组被初始化为全零数组,其他数组用numpy.random包中生成随机整数的函数进行初始化。
- 生成小方块。
下个步骤是生成小方块。使用上一步骤创建的数组生成小方块。通过使用clip函数,可以确保这些小方块不会超出图像区域。
meshgrid函数用来生成小方块的坐标。如果该函数的输入参数是大小为N和M的两个一维数组,则会返回两个N×M的二维数组。第一个数组中的元素沿x轴方向有规律地重复,第二个数组中的元素沿y轴方向有规律地重复。下面这段IPython会话清楚地展示了meshgrid函数的功能。
In: x = linspace(1, 3, 3)

In: x
Out: array([ 1.,  2.,  3.])
In: y = linspace(1, 2, 2)

In: y
Out: array([ 1.,  2.])

In: meshgrid(x, y)
Out:
[array([[ 1.,  2.,  3.],
        [ 1.,  2.,  3.]]),
array([[ 1.,  1.,  1.],
       [ 2.,  2.,  2.]])]
之后还需要设置小方块的颜色。
for i in xrange(NSQUARES):
    xindices = range(centers[i][0] - radii[i], centers[i][0] + radii[i])
    xindices = numpy.clip(xindices, 0, N - 1)
    yindices = range(centers[i][1] - radii[i], centers[i][1] + radii[i])
    yindices = numpy.clip(yindices, 0, N - 1)

    if len(xindices) == 0 or len(yindices) == 0:
        continue

    coordinates = numpy.meshgrid(xindices, yindices)
    img[coordinates] = colors[i]
- 加载图像数据到内存映射区。
在加载图像数据到内存映射区之前,需要先用tofile函数把图像保存到文件,然后再用memmap函数把图像数据从文件加载到内存映射区。
img.tofile('random_squares.raw')
    img_memmap = numpy.memmap
    ('random_squares.raw', shape=img.shape)
- 显示图像。
为了证明一切都符合预期,我们用Matplotlib显示图像。
matplotlib.pyplot.imshow(img_memmap)
matplotlib.pyplot.axis('off')
matplotlib.pyplot.show()
注意,这里设置了不显示坐标轴。最终生成的图像的一个实例如下。

本攻略的完整代码如下。
import numpy
import matplotlib.pyplot
import sys

N = 512

if(len(sys.argv) != 2):
    print "Please input the number of squares to generate"
    sys.exit()

NSQUARES = int(sys.argv[1])

# 初始化
img = numpy.zeros((N, N), numpy.uint8)
centers = numpy.random.random_integers(0, N, size=(NSQUARES, 2))
radii = numpy.random.randint(0, N/9, size=NSQUARES)
colors = numpy.random.randint(100, 255, size=NSQUARES)

# 生成小方块
for i in xrange(NSQUARES):
    xindices = range(centers[i][0] - radii[i], centers[i][0] + radii[i])
    xindices = numpy.clip(xindices, 0, N - 1)
    yindices = range(centers[i][1] - radii[i], centers[i][1] + radii[i])
    yindices = numpy.clip(yindices, 0, N - 1)

if len(xindices) == 0 or len(yindices) == 0:
    continue

coordinates = numpy.meshgrid(xindices, yindices)
    img[coordinates] = colors[i]

# 加载到内存映射区
img.tofile('random_squares.raw')
img_memmap = numpy.memmap('random_squares.raw', shape=img.shape)

# 显示图像
matplotlib.pyplot.imshow(img_memmap)
matplotlib.pyplot.axis('off')
matplotlib.pyplot.show()
小结
在本攻略中,我们用到了下列函数。
| 函数 | 功能描述 |
|---|---|
zeros |
创建一个全零数组 |
random_integers |
返回一个整数数组,其取值为上下边界值之间的随机整数 |
randint |
功能同random_integers |
clip |
给定最大值和最小值,对超出这个范围的数组元素的取值进行裁剪(使其等于最大值或最小值) |
meshgrid |
输入一个x坐标数组和一个y坐标数组,返回二维坐标数组 |
tofile |
把数组内容写入文件 |
memmap |
给定文件名,从该文件创建一个NumPy内存映射文件。可以指定数组的形状(可选) |
axis |
绘图时配置轴的Matplotlib函数,例如可以让轴不显示 |
 极客教程
极客教程