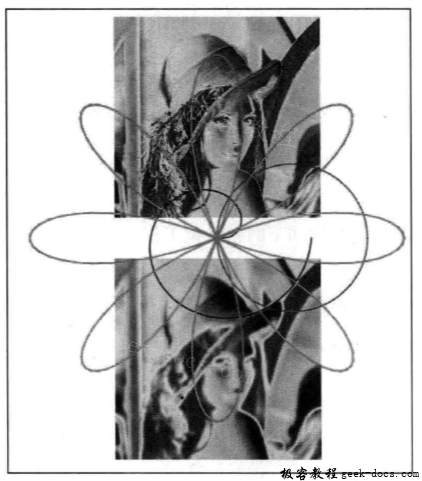
我们可以用高斯滤波器对图像进行模糊化处理。高斯滤波器基于正态分布。在SciPy中有一个对应的高斯滤波器函数,需要用标准差作为输入参数。
在本攻略中,我们还将绘制一条极坐标的玫瑰线(polar rose)和一条螺线。这些图案和图像的模糊化处理并不直接相关,把它们添加到图像中,只是为了更有趣。
具体步骤
为了在极坐标系下绘图,首先要做一些初始化工作。接着将对图像Lena进行模糊化处理,并把它绘制在极坐标平面内。
- 初始化。
为了在极坐标系下绘图,需要做如下的初始化工作。
NFIGURES = int(sys.argv[1])
k = numpy.random.random_integers
    (1, 5, NFIGURES)
a = numpy.random.random_integers
    (1, 5, NFIGURES)

colors = ['b', 'g', 'r', 'c',  'm', 'y', 'k']
- 对图像Lena进行模糊化处理。
使用高斯滤波器对图像Lena进行模糊化处理,标准差的取值为4。
matplotlib.pyplot.subplot(212)
blurred = scipy.ndimage.gaussian_filter
    (lena, sigma=4)

matplotlib.pyplot.imshow(blurred)
matplotlib.pyplot.axis('off')
- 在极坐标系下绘图。
Matplotlib中有一个polar函数,用来在极坐标系下绘图。
theta = numpy.linspace
    (0, k[0] * numpy.pi, 200)
matplotlib.pyplot.polar
    (theta, numpy.sqrt(theta), choice(colors))

for i in xrange(1, NFIGURES):
    theta = numpy.linspace
        (0, k[i] * numpy.pi, 200)
    matplotlib.pyplot.polar
        (theta, a[i] * numpy.cos(k[i] * theta), choice(colors))
最终生成如下的图形。

本攻略的完整代码如下。
import numpy
import matplotlib.pyplot
from random import choice
import sys
import scipy
import scipy.ndimage

# 初始化
NFIGURES = int(sys.argv[1])
k = numpy.random.random_integers(1, 5, NFIGURES)
a = numpy.random.random_integers(1, 5, NFIGURES)

colors = ['b', 'g', 'r', 'c', 'm', 'y', 'k']

lena = scipy.misc.lena()
matplotlib.pyplot.subplot(211)
matplotlib.pyplot.imshow(lena)
matplotlib.pyplot.axis('off')

# 对图像Lena进行模糊化处理
matplotlib.pyplot.subplot(212)
blurred = scipy.ndimage.gaussian_filter(lena, sigma=4)

matplotlib.pyplot.imshow(blurred)
matplotlib.pyplot.axis('off')

# 在极坐标系下绘图
theta = numpy.linspace(0, k[0] * numpy.pi, 200)
matplotlib.pyplot.polar(theta, numpy.sqrt(theta), choice(colors))

for i in xrange(1, NFIGURES):
    theta = numpy.linspace(0, k[i] * numpy.pi, 200)
    matplotlib.pyplot.polar(theta, a[i] * numpy.cos(k[i] * theta), choice(colors))

matplotlib.pyplot.axis('off')

matplotlib.pyplot.show()
小结
在本章中,我们用到了下列函数。
| 函数 | 功能描述 |
|---|---|
gaussian_filter |
应用高斯滤波器 |
random_integers |
返回一个数组,数组元素是给定的上下边界之间的随机整数 |
polar |
在极坐标系下绘图 |
 极客教程
极客教程