Matplotlib.axes.axes.get_title()
Matplotlib是Python中的一个库,它是NumPy库的数值-数学扩展。Axes包含了大多数图形元素:Axis、Tick、Line2D、Text、Polygon等,并设置坐标系。Axes的实例通过callbacks属性支持回调。
函数:Matplotlib.axes.axes.get_title()
matplotlib库的Axes模块中的Axes.get_title()函数用于获取Axes标题。
Axes.get_title(self, loc= ‘ center ‘)
参数:该方法接受以下参数。
- loc:该参数是一个可选参数,用于指定要获取的标题。
Return:该函数返回标题文本字符串。
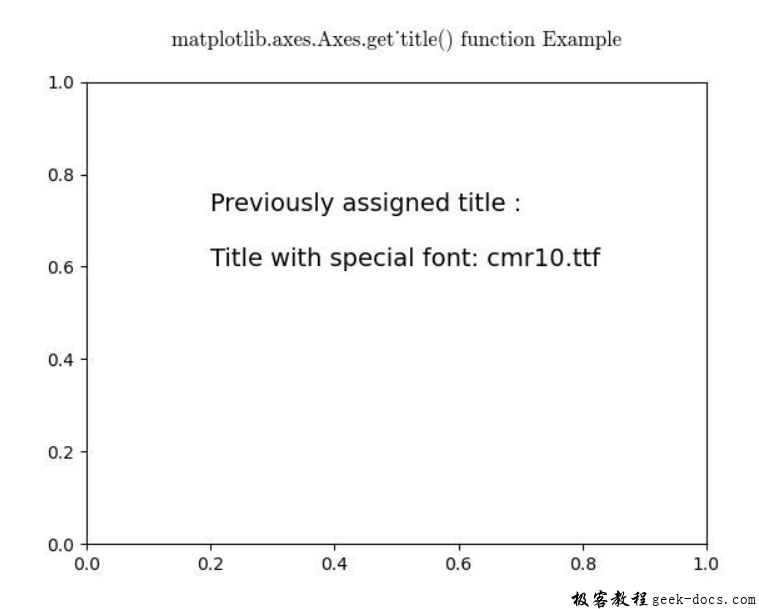
下面的例子演示了matplotlib.axes.axes.get_title()函数在matplotlib.axes中的作用:
示例1
# Implementation of matplotlib function
import os
from matplotlib import font_manager as fm, rcParams
import matplotlib.pyplot as plt

fig, ax = plt.subplots()

fpath = os.path.join(rcParams["datapath"],
                     "fonts / ttf / cmr10.ttf")
prop = fm.FontProperties(fname = fpath)
fname = os.path.split(fpath)[1]
ax.set_title('Title with special font: {}'.format(fname),
             fontproperties = prop, fontsize = 14)

w = ax.get_title()
ax.text(0.2, 0.6, "Previously assigned title : \n\n"+str(w),
        fontsize = 14)
ax.set_title("matplotlib.axes.Axes.get_title() \
function Example\n", fontweight ="bold")
plt.show()
输出:

示例2
# Implementation of matplotlib function
import numpy as np
import matplotlib.pyplot as plt

x = np.arange(0.1, 5, 0.1)
y = np.exp(-x)

yerr = 0.1 + 0.1 * np.sqrt(x)

fig, (ax, ax1) = plt.subplots(nrows = 1,
                              ncols = 2,
                              sharex = True)

ax.errorbar(x, y, yerr = yerr, color ="green")
ax.set_title('Title of Axes 1', fontweight ="bold")

ax1.errorbar(x, y, yerr = yerr, errorevery = 5,
             color ="green")
ax1.set_title('Title of Axes 2', fontweight ="bold")

w = ax.get_title()
ww = ax1.get_title()
ax.set_title("")
ax1.set_title("")

ax.set_xlabel(w)
ax1.set_xlabel(ww)

fig.suptitle("Previously assigned title of each Axes is\
 used at labels\n", fontweight ="bold")
plt.show()
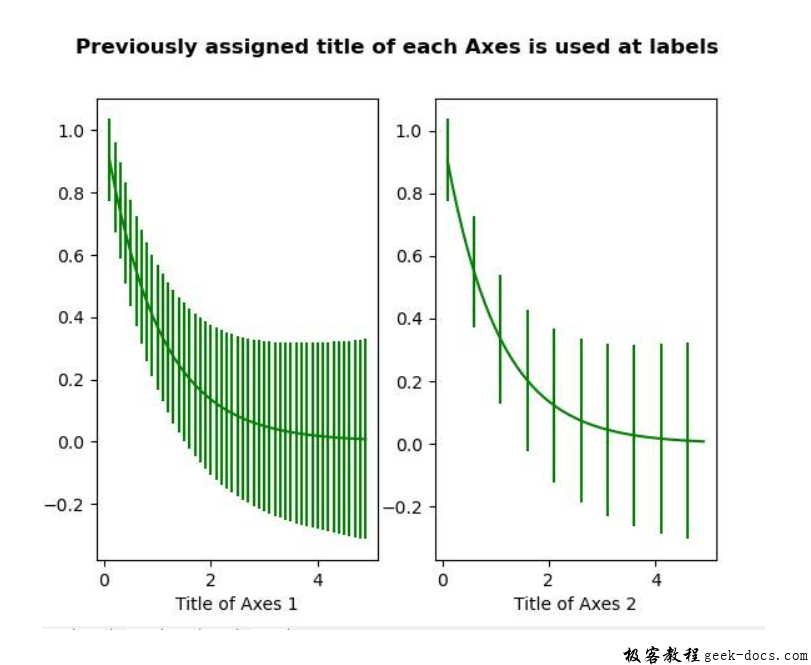
输出:

 极客教程
极客教程