MATLAB中的坐标轴外观和行为
MATLAB提供了许多类型的轴,如极坐标轴、直角坐标轴等。这些轴的默认外观是由MATLAB根据具体的要求动态确定的。然而,MATLAB确实为其用户提供了一个选项,即通过使用一些内置函数来改变这些坐标轴的行为。在本文中,我们将介绍如何使用这些函数来改变软轴的外观;同样的方法也可以应用于极轴和其他可用的轴类型。
轴的属性
1.轴的刻度
2.网格和网格线
3.轴标签
4.传说
5.同一轴线上的多幅图
6.轴的位置和长宽比
7.轴的限制
让我们用一个例子来看看每个属性。
Axes Ticks
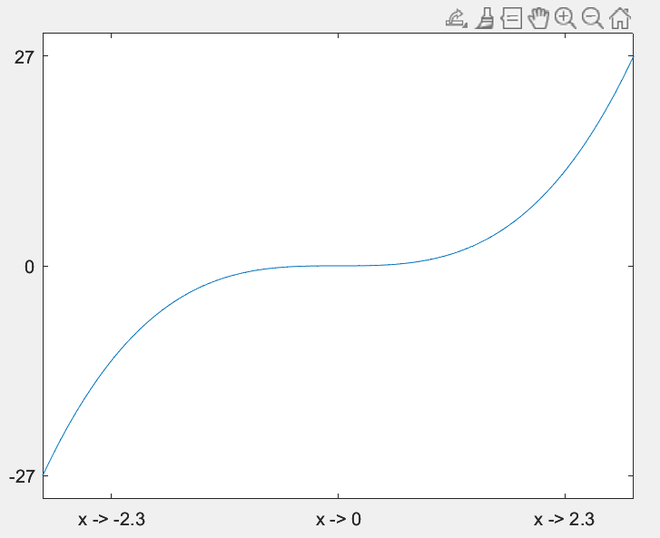
我们可以改变标有X刻度的点的数值以及它们的标签。
语法:
xticks([<vector containing tick points>])

xticklabels({<array with the tick labels>})
同样的方法也可用于y和z刻度线。
示例 1:
% MATLAB code for Axes ticks
x = linspace(-3,3,100);
plot(x,x.^3)

% Changing xtick values
xticks([-2.3,0,2.3])

% Changing xtick labels
xticklabels({'x -> -2.3','x -> 0','x -> 2.3'})

% Changing ytick values
yticks([-27,0,27])
输出:
网格和网格线
在MATLAB中,我们可以选择显示网格线,也可以选择小网格线。在次要网格线的情况下,刻度点上的网格线是正常的,而主要刻度点之间的线条则比较模糊。同样的语法是。
plots

…………

grid on

grid minor
请看下面的实施方案,以便理解。
示例 2:
% MATLAB code for Grid and Gridlines
x = linspace(-3,3,100);
plot(x,x.^3)

% Turning on grid
grid on

% Turning on minor gridlines
grid minor
输出:
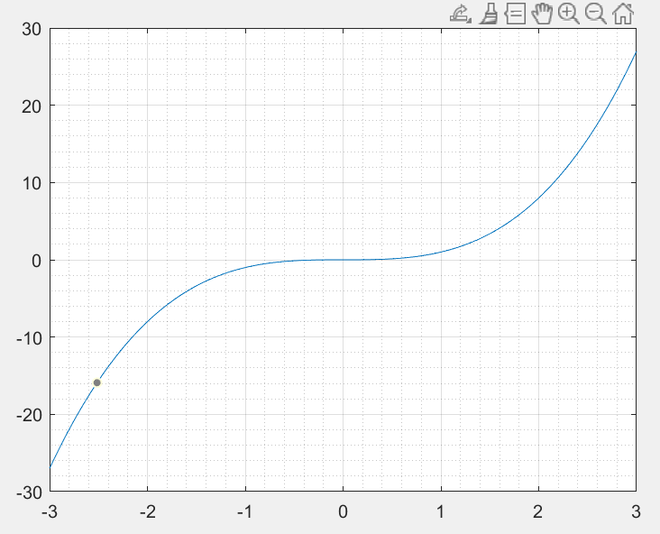
可以看出,x和y刻度点上的网格线比它们之间的网格线更密集。
轴标签
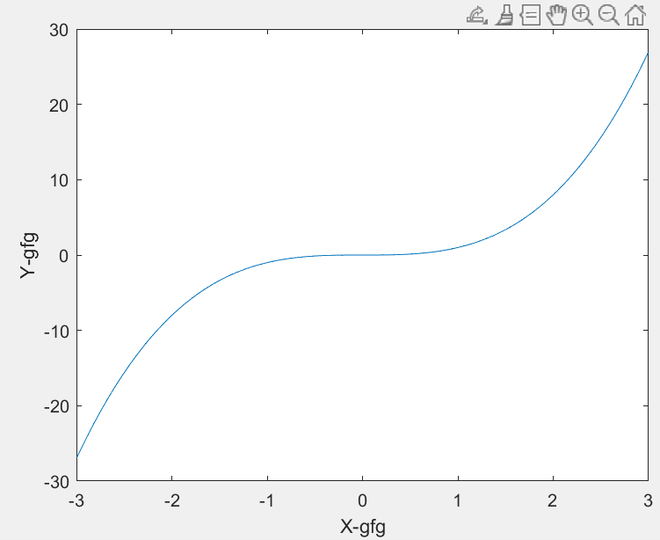
你可以通过使用以下命令简单地改变x、y和/或z轴的标签
xlabel(‘label1’)

ylabel(‘label2’)

zlabel(‘label3’)
示例 3:
% MATLAB code for Axes Label
x = linspace(-3,3,100);
plot(x,x.^3)

% Defining x label
xlabel("X-gfg")

% Defining y label
ylabel("Y-gfg")
输出:
Legends
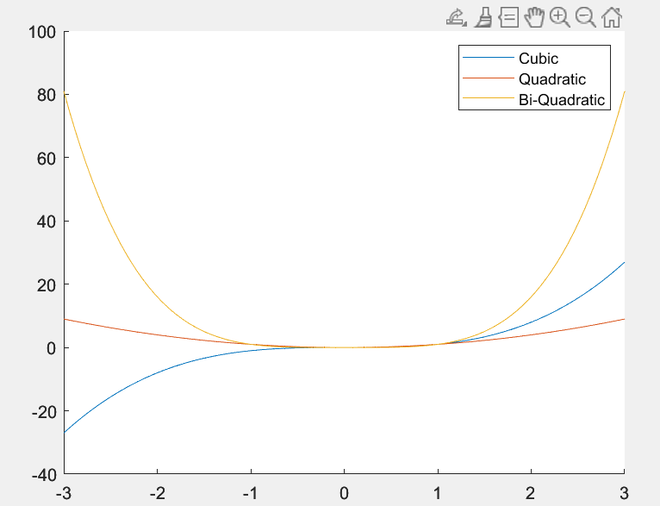
我们可以在 legend() 函数的帮助下为一组轴添加图例。
语法:
legend(text1, ..., textN)
示例 4:
% % MATLAB code for Legends
x = linspace(-3,3,100);

hold on
plot(x,x.^3)
plot(x,x.^2)
plot(x,x.^4)
hold off

% Adding legends
legend("Cubic","Quadratic","Bi-Quadratic")
输出:
同一轴上的多个图
正如在前面的例子中看到的,我们可以使用保持触发器在同一轴上添加多个图。其语法为:。
hold on

plot1

plot2

.

.plot N

hold off
这将绘制所有在保持开启和保持关闭命令之间写入的绘图。
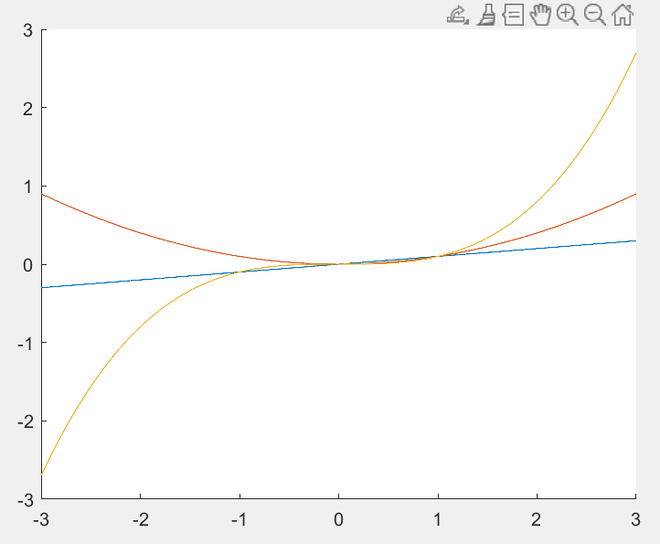
示例 5
y=x的线性、二次和三次多项式的绘图。
% % MATLAB code for Multiple Plots
% on the Same axes
x = linspace(-3,3,10000);

hold on
plot(x,.1*x)
plot(x,.1*x.^2)
plot(x,.1*x.^3)
hold off
输出:
改变轴的位置和长宽比
我们可以通过向axes()函数提供Position参数来修改图形组件上的轴的位置和大小。以下是相同的语法。
axes_name = axes(‘Position’, [<vector defining the location and size of axes in figure component>])
该向量是一个1×4行向量,其语法如下
[<position of left side> <position of bottom> <width of axes> <height of axes>]
所有这些值的取值范围是0到1,其中0定义为极左/底部,1定义为极右/顶部。
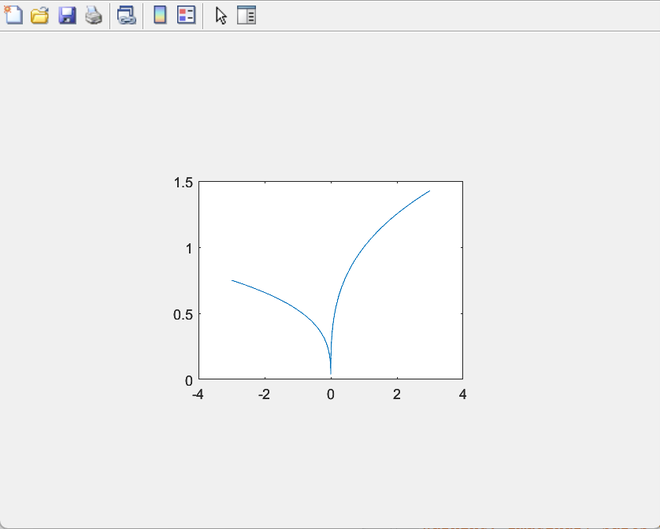
请看下面的例子,我们在图的中心位置创建软轴
示例 6:
% % MATLAB code f
x = linspace(-3,3,10000);

% Defining position in center
ax=axes('Position',[.3 .3 .4 .4]);
plot(ax,x,x.^0.324)
输出:
轴的限制
我们可以通过以下函数修改x、y和z轴的可见范围。
xlim([<left_limit> <right_limit>])
ylim([<left_limit> <right_limit>])
zlim([<left_limit> <right_limit>])
这将只在给定范围内显示各自的轴。
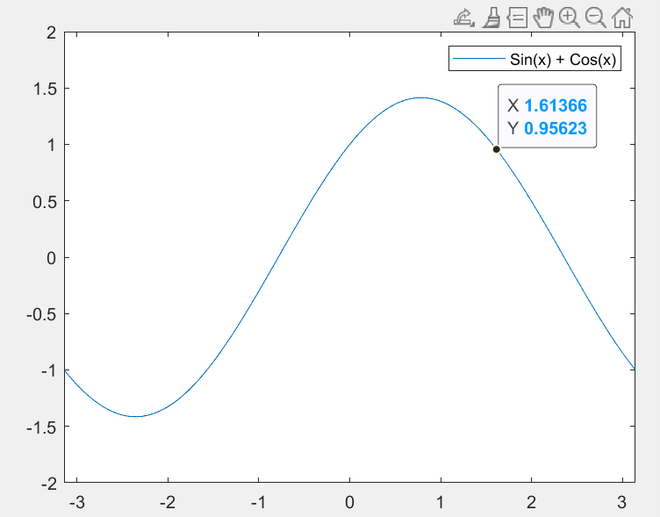
示例 7:
% % MATLAB code for Axes Limits
x = linspace(-35,35,10000);
plot(x,sin(x)+cos(x))

% Defining x limits
xlim([-pi pi])

% Defining y limits
ylim([-2 2])
legend('Sin(x) + Cos(x)')
输出:
 极客教程
极客教程