在MATLAB中为轴添加图例
MATLAB提供了legend()函数来为一组轴添加图例,这使得图例制作变得简单而高效。在本文中,我们将通过各种实例来了解如何在MATLAB中为单个和多个车轴添加图例。
语法:
plot(…)

legend (‘label1’, ‘label2’, …, ‘label_N’)
现在,标签可以是字符串、字符串向量或单元格阵列。
为一个简单的正弦和余弦函数图添加图例。
示例 1:
% MATLAB code for adding legend to a
% simple sine and cosine function plot
% Defining xrange
rng = linspace(-pi,pi,1000);

% Plotting sine
plot(rng, sin(rng))

% Holding the earlier plot for simultaneous plotting
hold on

% Plotting cosine
plot(rng,cos(rng))

% Adding legend, with same order as of plotting
legend('Sine','Cosine')
输出:

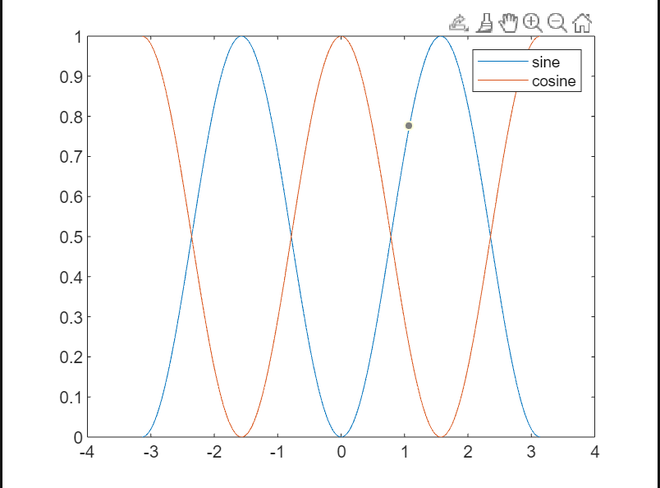
用单元格阵列添加图例。
示例 2:
% MATLAB code for range
rng = linspace(-pi,pi,1000);

% Plotting sin^2
plot(rng, sin(rng).^2)
hold on

% Plotting cos^2
plot(rng,cos(rng).^2)

% Creating an array of character vectors
lgd = {'sine', 'cosine'};

% Converting the array into cell array
lgd=cell(lgd);

% Adding legend
legend(lgd)
输出:

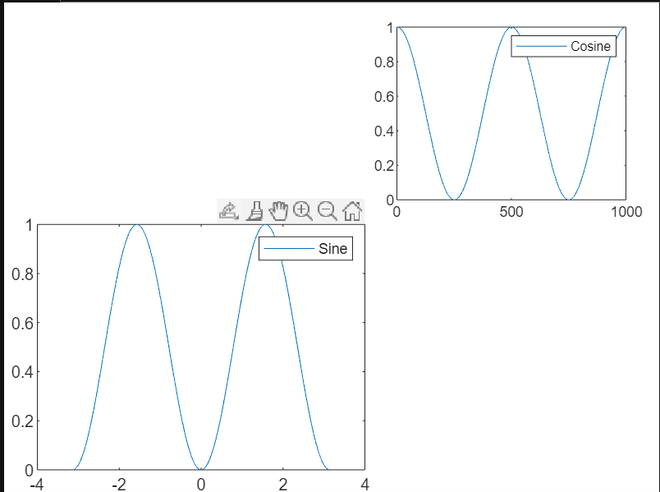
现在,让我们为同一个图中的多个轴添加不同的图例。
示例 3:
% MATLAB code to add different legends to
% multiple axes in the same figure.
rng = linspace(-pi,pi,1000);

% Defining two axes
ax1 = axes('Position',[0.05 0.05 0.5 0.5]);
ax2 = axes('Position',[0.6 0.6 0.35 0.35]);

% Plotting in each axes
plot(ax1, rng, sin(rng).^2)

% Plotting legend for axes 1
legend(ax1,'Sine')
plot(ax2,cos(rng).^2)

% Plotting legend for axes 1
legend(ax2,'Cosine')
输出:

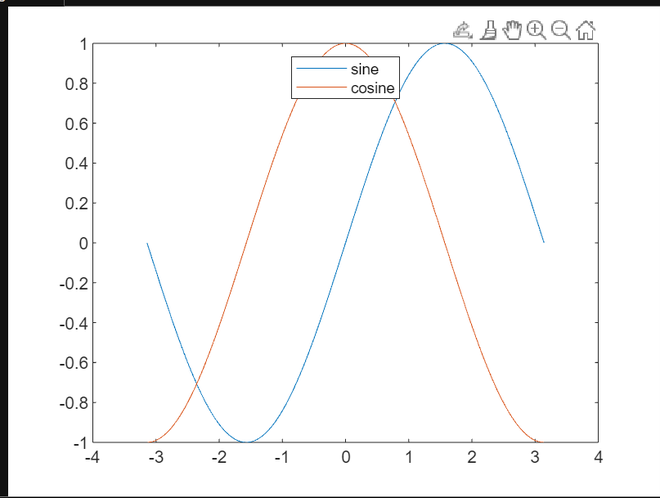
为了改变图形中轴的位置,我们可以使用 “位置 “参数,并指定位置为 “东北”、”南 “等。让我们看一个例子,我们把图例从东北方向移到北方。
示例 4:
% MATLAB code for changing the
% location of axes in the graph
rng = linspace(-pi,pi,1000);

% Plotting  curves
plot(rng, sin(rng))
hold on
plot(rng,cos(rng))
hold off

% Adding legend
lgd = {'sine', 'cosine'};
lgd=cell(lgd);
legend(lgd,'Location','north')
输出:

 极客教程
极客教程