如何使用CanvasJS从XML文件创建图表
Canvas JS是一款支持多种设备显示图表的库,使用HTML和Javascript非常简单。它提供了一个不同的插件选项,可以使用XML文件中的数据创建基本图表。在本文中,我们将学习如何使用Canvas JS插件从外部XML文件创建图表。
方法: 使用Canvas JS插件从XML文件创建图表的方法如下:
- 在HTML设计中使用
<div>标签来显示所选择的图表。 - 在代码的script部分,通过设置type、data、datapoints和其他选项属性来实例化CanvasJS对象。
- 在代码的head部分包含CDN链接以使用插件的功能。
- 使用Canvas JS插件的render()方法渲染图表。
- 根据需要设置其他属性或样式来进行图表的样式化,如下面示例代码所示。
- 根据可用的数据为代码实现创建图表。使用jQuery的get()方法和find()方法提取XML文件中的数据。使用jQuery的push()方法将提取的数据推送到一个空数组中,如代码所示。
CDN链接:
 <script src=
 "https://canvasjs.com/assets/script/jquery-1.11.1.min.js">
 </script>
 <script type=
 "text/javascript" src="https://cdn.canvasjs.com/canvasjs.min.js">
</script>
下面的XML数据将在两个代码示例中使用:
employee.xml: 这个文件用于在两个代码示例中提取数据。
<?xml version="1.0" encoding="utf-8"?>
<employees>
    <employee id="be129">
        <firstname>Jitendra</firstname>
        <lastname>Kumar</lastname>
        <title>Engineer</title>
        <division>Materials</division>
        <total_projects>312</total_projects>
        <expected_projects>299</expected_projects>
    </employee>
    <employee id="be130">
        <firstname>Amit</firstname>
        <lastname>Kumar</lastname>
        <title>Accountant</title>
        <division>Accts Payable</division>
        <total_projects>320</total_projects>
        <expected_projects>300</expected_projects>
    </employee>
    <employee id="be131">
        <firstname>Akash</firstname>
        <lastname>Kumar</lastname>
        <title>Engineering Manager</title>
        <division>Materials</division>
        <total_projects>328</total_projects>
        <expected_projects>210</expected_projects>
    </employee>
    <employee id="be132">
        <firstname>Aishwarya</firstname>
        <lastname>Kulshrestha</lastname>
        <title>Engineer</title>
        <division>Materials</division>
        <total_projects>231</total_projects>
        <expected_projects>220</expected_projects>
    </employee>
    <employee id="be133">
        <firstname>Sachin</firstname>
        <lastname>Kumar</lastname>
        <title>Engineer</title>
        <division>Materials</division>
        <total_projects>327</total_projects>
        <expected_projects>240</expected_projects>
    </employee>
    <employee id="be135">
        <firstname>Vikash</firstname>
        <lastname>kumar</lastname>
        <title>COO</title>
        <division>Management</division>
        <total_projects>216</total_projects>
        <expected_projects>200</expected_projects>
    </employee>
    <employee id="be136">
        <firstname>Suvam</firstname>
        <lastname>Basak</lastname>
        <title>Accountant</title>
        <division>Accts Payable</division>
        <total_projects>226</total_projects>
        <expected_projects>300</expected_projects>
    </employee>
    <employee id="be135">
        <firstname>Abhinav</firstname>
        <lastname>kumar</lastname>
        <title>COO</title>
        <division>Management</division>
        <total_projects>216</total_projects>
        <expected_projects>320</expected_projects>
    </employee>
     <employee id="be131">
        <firstname>DhanPal</firstname>
        <lastname>Singh</lastname>
        <title>Engineering Manager</title>
        <division>Materials</division>
        <total_projects>327</total_projects>
        <expected_projects>210</expected_projects>
    </employee>
</employees>
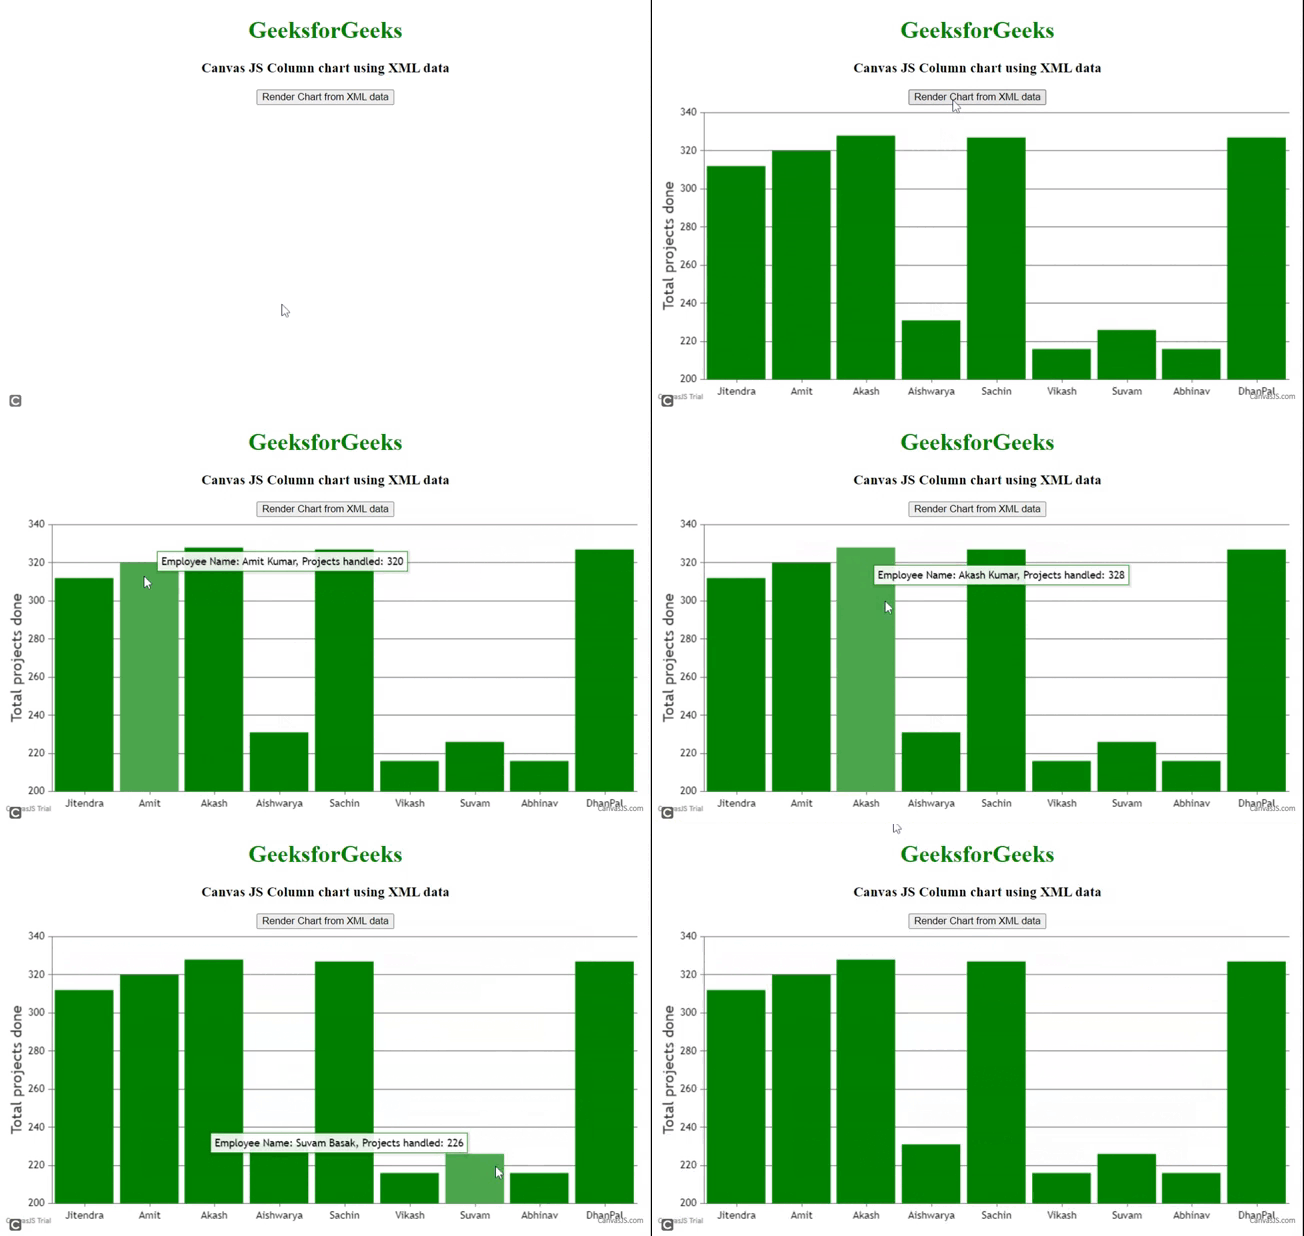
示例1: 此示例通过使用Canvas JS插件和外部XML文件中的各种数据,展示了不同员工完成的总项目的柱状图。图表通过使用jQuery的按钮点击事件进行呈现。
HTML
<!DOCTYPE html>
<html>

<head>
    <title>Column Chart using XML Data</title>

    <script type="text/javascript" src=
"https://canvasjs.com/assets/script/jquery-1.11.1.min.js">
    </script>
    <script type="text/javascript" src=
"https://cdn.canvasjs.com/canvasjs.min.js">
    </script>
    <style>
        .canvasjs-chart-tooltip {
            pointer-events: auto !important;
        }
    </style>
    <script type="text/javascript">
        (document).ready(function () {
            ("#btnID").click(function () {
                var myarray = [];
                .get("employee.xml", function (data) {

                    (data).find("employee").each(function () {

                        // Access to the object it belongs to
                        var thisDataPoint =(this);

                        // Return the text content of the element.
                        var x = thisDataPoint.find("firstname").html();
                        var x1 =thisDataPoint.find("lastname").html();
                        var y = $thisDataPoint.find("total_projects").html();
                        var name = x + " " + x1;

                        // Add one or more values to the end of the array.
                        myarray.push(
                            {
                                y: parseFloat(y),
                                label: String(x),
                                name: String(name)
                            }
                        );
                    });    // End find

                    var chart = new CanvasJS.Chart("chartID", {
                        animationEnabled: true,
                        axisY: {
                            title: "Total projects done"
                        },
                        toolTip: {
                            shared: true,
                            enabled: true,
                            content:
                          "Employee Name: {name}, Projects handled: {y}",
                        },
                        data: [{
                            type: "column",
                            color: "green",
                            dataPointWidth: 30,
                            indexLabelOrientation: "horizontal",
                            dataPoints: myarray,
                        }]
                    }); // End chart

                    chart.render();

                });// End get
            });// End button click
        });// End document ready
    </script>
</head>

<body>
    <div style="text-align:center">
        <h1 style="color:green">
              GeeksforGeeks
          </h1>
        <h3>
              Canvas JS Column chart using XML data
          </h3>
    </div>
    <center>
        <button id="btnID">
            Render Chart from XML data
        </button>
    </center>
    <div id="chartID"
         style="height:400px;
                max-width:950px;
                margin:0px auto;">
    </div>
</body>

</html>
输出:

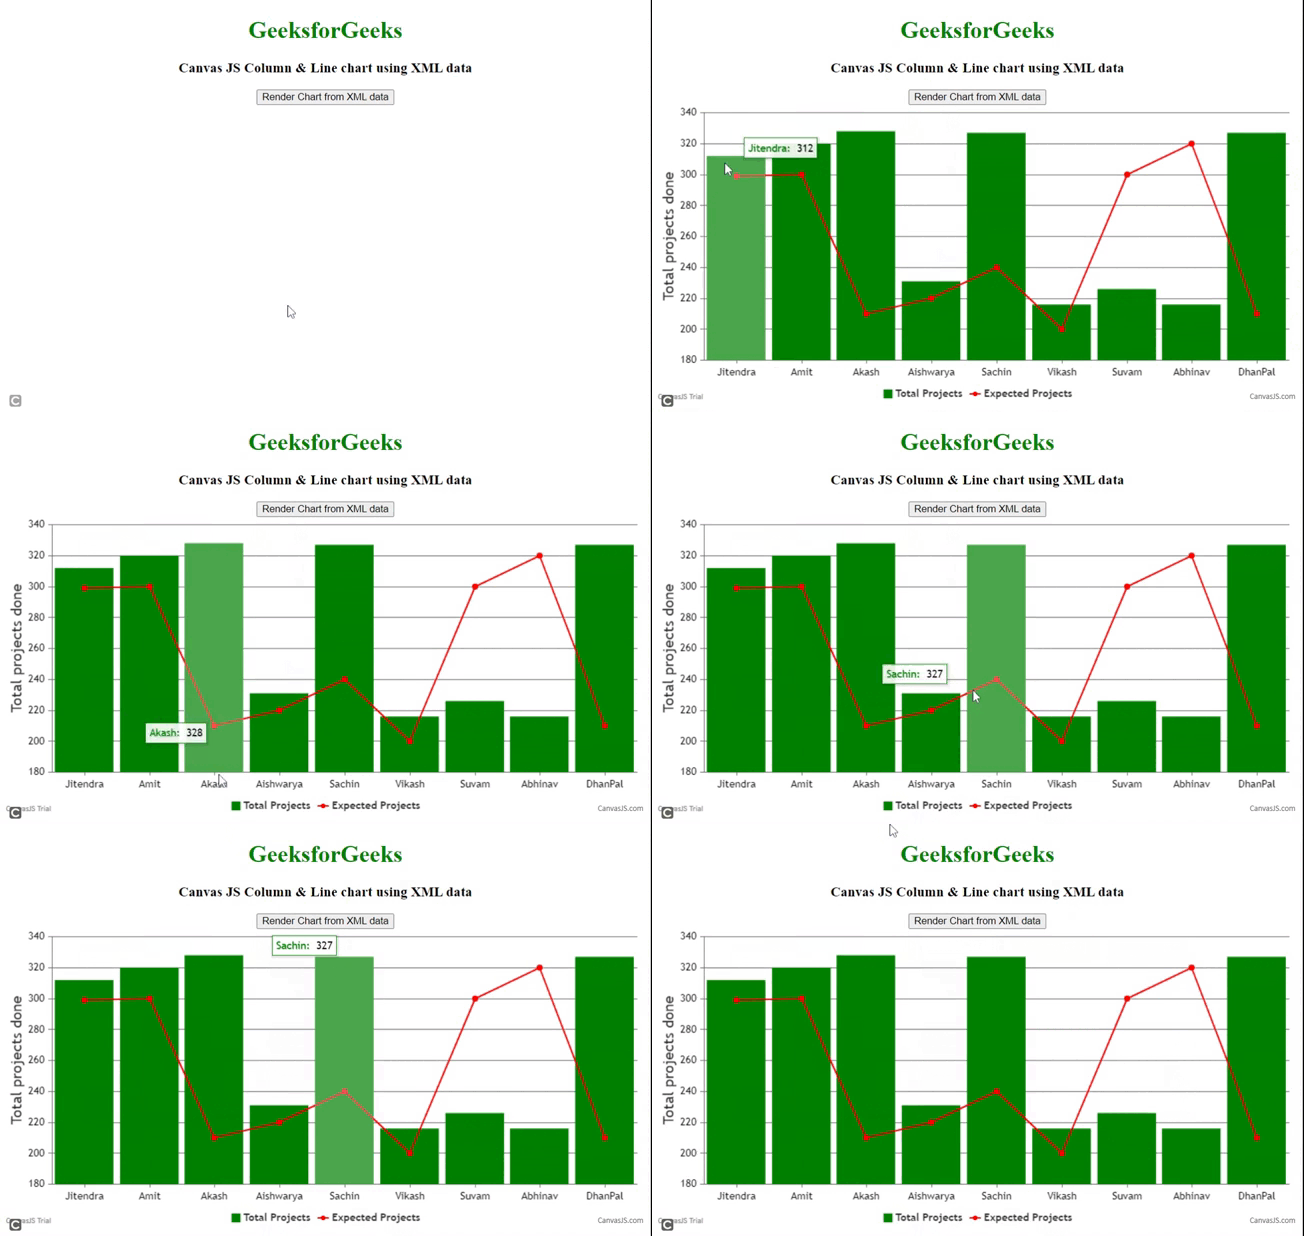
示例2: 此示例演示了使用Canvas JS插件和外部XML文件绘制的总项目和不同员工完成的预期项目的列和线状图。(代码中使用的是相同的“employee.xml”文件,如上所示。)
HTML
<!DOCTYPE html>
<html>

<head>
    <title>
          Column-Line Chart using XML Data
      </title>
    <script type="text/javascript"
            src=
"https://canvasjs.com/assets/script/jquery-1.11.1.min.js">
    </script>
    <script type="text/javascript"
            src=
"https://cdn.canvasjs.com/canvasjs.min.js">
    </script>
    <style>
        .canvasjs-chart-tooltip {
            pointer-events: auto !important;
        }
    </style>

    <script type="text/javascript">
        (document).ready(function () {
            ("#btnID").click(function () {

                var myarray = [];
                var myLinearray = [];
                .get("employee.xml", function (data) {

                    (data).find("employee").each(function () {

                        // Access to the object it belongs to
                        var thisDataPoint =(this);

                        // Return the text content of the element.
                        var x = thisDataPoint.find("firstname").html();
                        var x1 =thisDataPoint.find("lastname").html();
                        var y = thisDataPoint.find("total_projects").html();
                        var exProjects =
                            thisDataPoint.find("expected_projects").html();
                        var name = x + " " + x1;

                        // Add one or more values to the end of the array.
                        myarray.push(
                            {
                                y: parseFloat(y),
                                label: String(x),
                                name: String(name)
                            }
                        );
                        myLinearray.push(
                            {
                                y: parseFloat(exProjects),
                                label: String(x),
                                name: String(name),
                            }
                        );
                    });    // End find

                    var chart = new CanvasJS.Chart("chartID", {
                        animationEnabled: true,
                        axisY: {
                            title: "Total projects done"
                        },
                        toolTip: {
                            enabled: true,
                        },
                        data: [{
                            type: "column",
                            name: "Total Projects",
                            showInLegend: true,
                            color: "green",
                            dataPointWidth: 30,
                            indexLabelOrientation: "horizontal",
                            dataPoints: myarray,
                        },
                        {
                            type: "line",
                            name: "Expected Projects",
                            showInLegend: true,
                            yValueFormatString: "###",
                            color: "red",
                            dataPoints: myLinearray
                        }
                        ]// End data
                    });// End chart

                    chart.render();

                });// End get
            });// End button click
        });// End document ready
    </script>
</head>

<body>
    <div style="text-align:center">
        <h1 style="color:green">
              GeeksforGeeks
          </h1>
        <h3>
              Canvas JS Column & Line chart using XML data
          </h3>
    </div>
    <center>
        <button id="btnID">
            Render Chart from XML data
        </button>
    </center>
    <div id="chartID"
         style="height:400px;
                max-width:950px;
                margin:0px auto;">
    </div>
</body>

</html>
输出:

 极客教程
极客教程