如何使用CanvasJS在PHP中创建动态的饼图和漏斗图
在本文中,我们将学习如何使用CanvasJS插件动态实现PHP中的饼图和漏斗图。
饼图或圆环图在数据处理中是一种用于表示给定数据集的图形表示方法,它通过将一个圆形统计图形分割成扇形或扇区来说明数值问题。这里,“饼”一词对应于整体,而“扇区”或“切片”对应于整体的部分。
漏斗图是一种用于表示数据如何通过过程移动的图表类型。漏斗图广泛用于表示销售漏斗、招聘和订单履行过程。
语法:
new CanvasJS.Chart($("#ID"), {
  data: [{
      type: "pie",
      dataPoints: [
        {...},
    ]
  }]
});
注意: 在使用Canvas JS实现漏斗图时,将type属性更改为“funnel”。
做法:
- 在PHP部分的代码中,数据以数组的形式存在,其中数组表示要在所选图表中显示的数据。
- 在HTML设计中,使用
<
div>标签来显示饼图或漏斗图。
* 在代码的script部分,通过设置库的type、data、datapoints和其他选项属性来实例化CanvasJS对象。
* 在代码的head部分中包含CDN链接以使用插件的功能。
* 在主页面上的按钮点击事件上使用Canvas JS插件的render()方法呈现图表。
* 根据下面的示例代码所示,根据可用的代码实现数据制作图表。
* 根据需要设置图表的其他属性或样式。
CDN链接:
<script src=
"https://canvasjs.com/assets/script/canvasjs.min.js">
</script>
示例1:
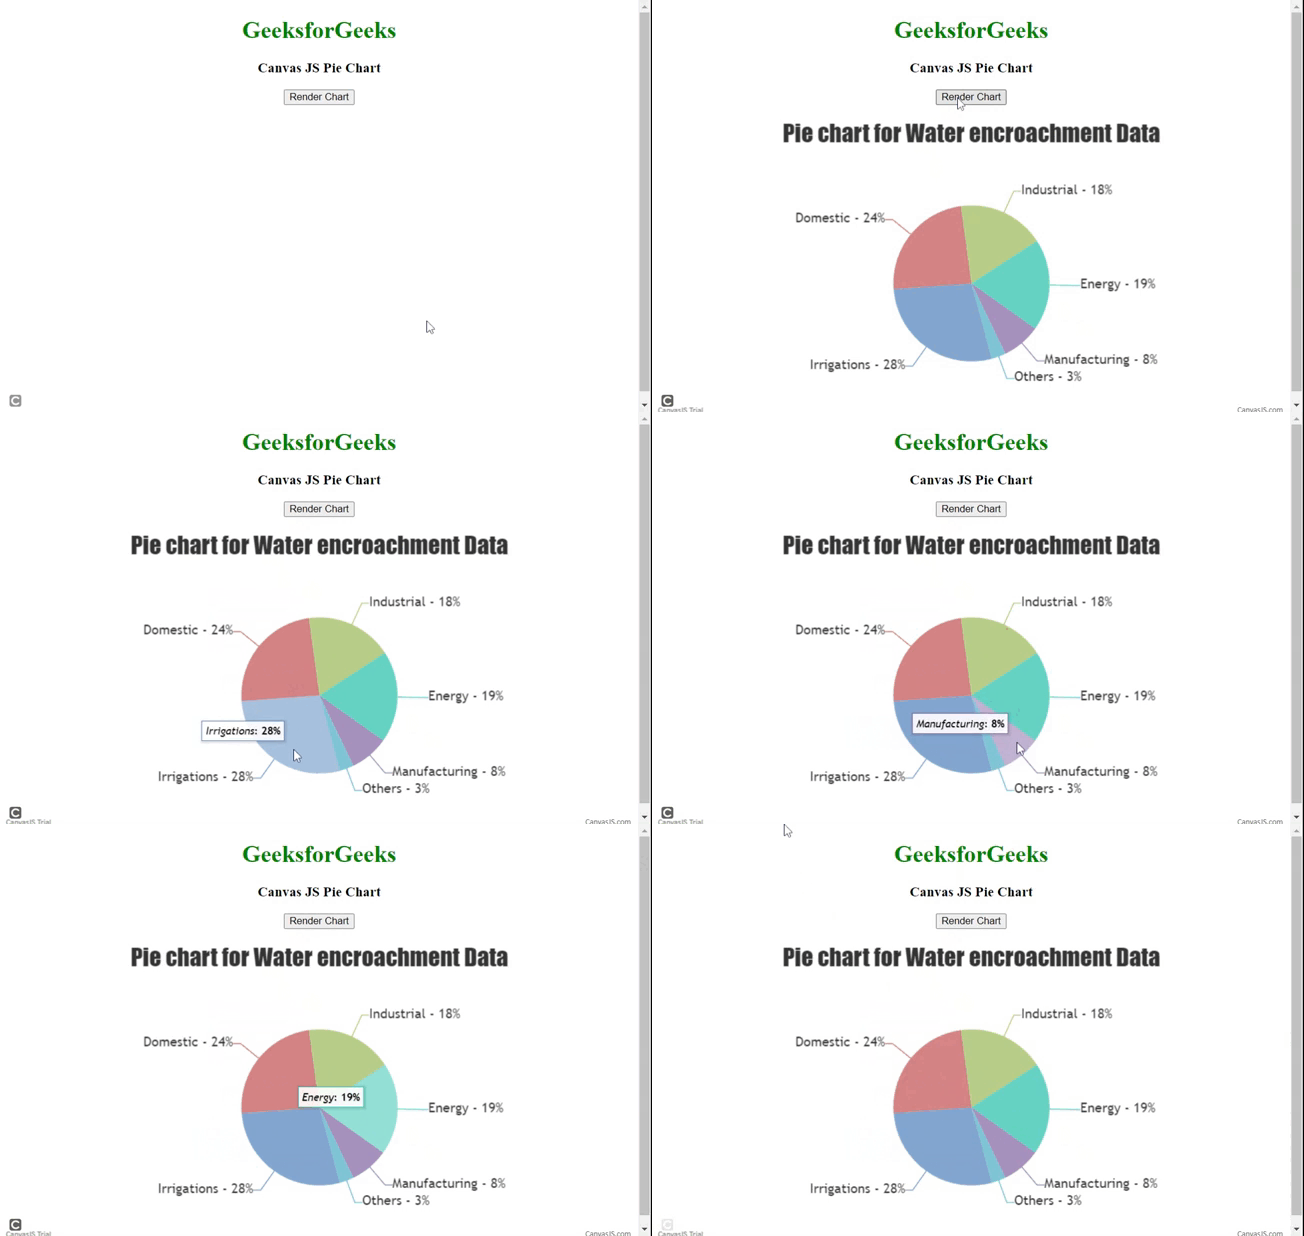
以下代码演示了一个简单的饼状图示例,显示了水陆侵蚀数据以饼状扇区的形式。初始数据以 PHP 数组的形式提供,后来在代码的脚本部分中使用 Canvas JS 对象进行实例化。图表在 HTML 部分的按钮的点击事件中渲染。
PHP
<?php
    myArray = array(
        array("label"=>"Irrigations", "y"=>28),
        array("label"=>"Domestic", "y"=>24),
        array("label"=>"Industrial", "y"=>18),
        array("label"=>"Energy", "y"=>19),
        array("label"=>"Manufacturing", "y"=>8),
        array("label"=>"Others", "y"=>3)
    )
?>
<!DOCTYPE HTML>
<html>
<head>
    <script type="text/javascript" src=
"https://canvasjs.com/assets/script/jquery-1.11.1.min.js">
   </script>
    <script type="text/javascript" src=
"https://canvasjs.com/assets/script/canvasjs.min.js">
    </script>
    <script>
        (document).ready(function(){

            // User dynamic data from PHP
            var passedArray =   <?php echo json_encode(myArray); ?>;

            ("#btnID").click(function(){

                var chart = new CanvasJS.Chart("chartID", {
                    title:{
                        text: "Pie chart for Water encroachment Data"
                    },
                    data: [{
                        type: "pie",
                        animationEnabled: true,
                        indexLabelFontSize: 18,
                        fillOpacity: .7,
                        toolTipContent: "<i>{label}</i>: <b>{y}</b>",
                        radius: "80%",
                        startAngle: 75,
                        indexLabel: "{label} - {y}",
                        yValueFormatString: "##\"%\"",
                        dataPoints: passedArray
                    }]    // End data

                });// End chart
                chart.render();

            });// End button click
        });// End document ready
    </script>
</head>
<body>
    <div style="text-align:center">
        <h1 style="color:green">
              GeeksforGeeks
          </h1>
        <h3>
              Canvas JS Pie Chart
          </h3>
    </div>
    <center>
        <button id="btnID">
            Render Chart
        </button>
    <center><br>
    <div id="chartID"
         style="height:400px;
                max-width:950px;
                margin:0px auto;">
    </div>
</body>

</html>
输出:

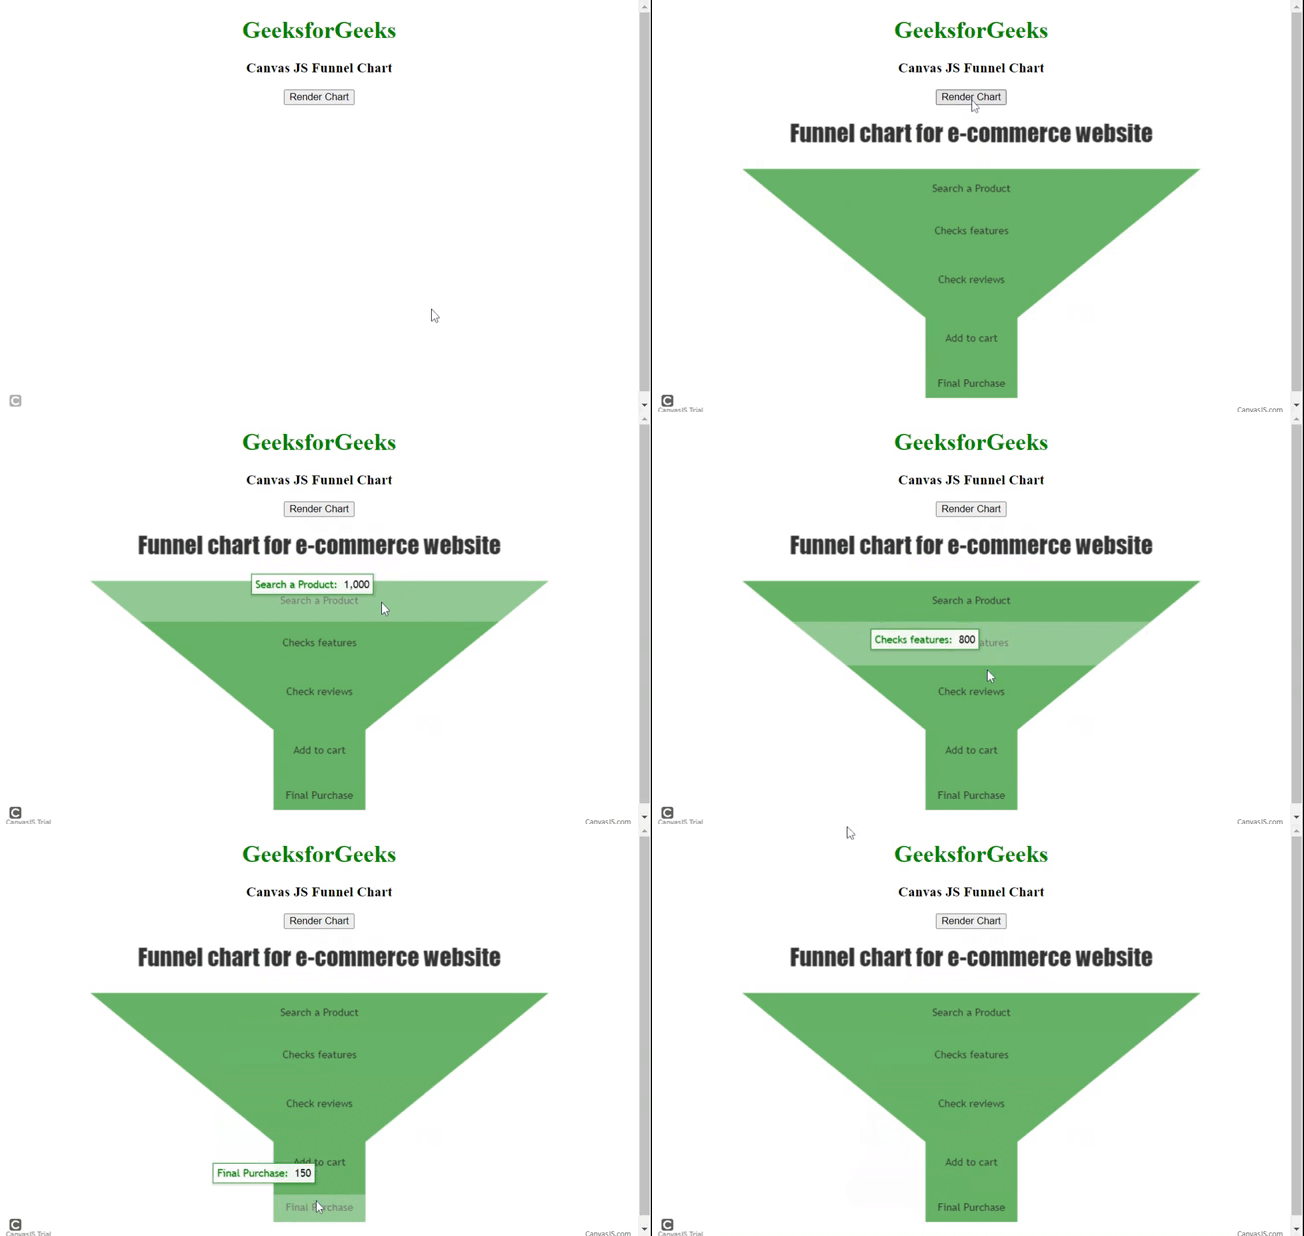
示例2: 下面的代码演示了一个非常简单的图表示例,显示了电子商务网站的多个阶段。如前所述,初始数据以PHP数组的形式提供。通过添加或设置不同的自定义选项,仅使用属性如indexLabelPlacement、valueRepresents、color、fillOpacity、neckHeight和neckWidth来改变图表的外观。请参考输出以获得更好的理解。
PHP
<?php
    myarray = array(
        array("label"=>"Search a Product", "y"=>1000),
        array("label"=>"Checks features", "y"=>800),
        array("label"=>"Check reviews", "y"=>600),
        array("label"=>"Add to cart", "y"=>350),
        array("label"=>"Final Purchase", "y"=>150)
    )
?>
<!DOCTYPE HTML>
<html>
<head>
    <script type="text/javascript" src=
"https://canvasjs.com/assets/script/jquery-1.11.1.min.js">
   </script>
    <script type="text/javascript" src=
"https://canvasjs.com/assets/script/canvasjs.min.js">
    </script>
    <script>
        (document).ready(function(){

            // User dynamic data from PHP
            var passedArray =
                  <?php echo json_encode(myarray); ?>;

            ("#btnID").click(function(){

                var chart = new CanvasJS.Chart("chartID", {
                    title: {
                        text: "Funnel chart for e-commerce website"
                    },
                    data: [{
                        type: "funnel",
                        indexLabelPlacement: "inside",
                        valueRepresents: "area",
                        color: "green",
                        fillOpacity: .6,

                        // Height of the funnel neck
                        neckHeight:  "35%",
                        neckWidth:  "20%",
                        dataPoints: passedArray
                    }]// End data

                });// End chart

                chart.render();

            });// End button click
        });// End document ready
    </script>
</head>

<body>
    <div style="text-align:center">
        <h1 style="color:green">
              GeeksforGeeks
          </h1>
        <h3>Canvas JS Funnel Chart </h3>
    </div>
    <center>
        <button id="btnID">
            Render Chart
        </button>
    <center><br>
    <div id="chartID"
         style="height:400px;
                max-width:950px;
                margin:0px auto;">
    </div>
</body>

</html>
输出:

每当用户需要展示整体数据的一个部分或者切片时,我们使用饼图。每当我们需要展示整个长过程的多个阶段时,最好使用交互式漏斗图。
 极客教程
极客教程