Angular PrimeNG DoughnutChart组件
Angular PrimeNG是一个开源框架,它有丰富的原生Angular UI组件,可以用来做很好的造型,这个框架用来做响应式网站,非常方便。在这篇文章中,我们将看到Angular PrimeNG中的DoughnutChart组件。
甜甜圈图是饼图的一个变种,中间是空白的,可以包括关于整个数据的额外信息。
语法:
<p-chart type="doughnut"
         [data]="data"
         [options]="chartOptions" >
</p-chart>
创建Angular应用程序和模块安装。
第1步:使用以下命令创建一个Angular应用程序。
ng new appname
第2步:创建你的项目文件夹即appname后,使用以下命令移动到它。
cd appname
第3步:在你给定的目录中安装PrimeNG。
npm install primeng --save
npm install primeicons --save
npm install chart.js --save
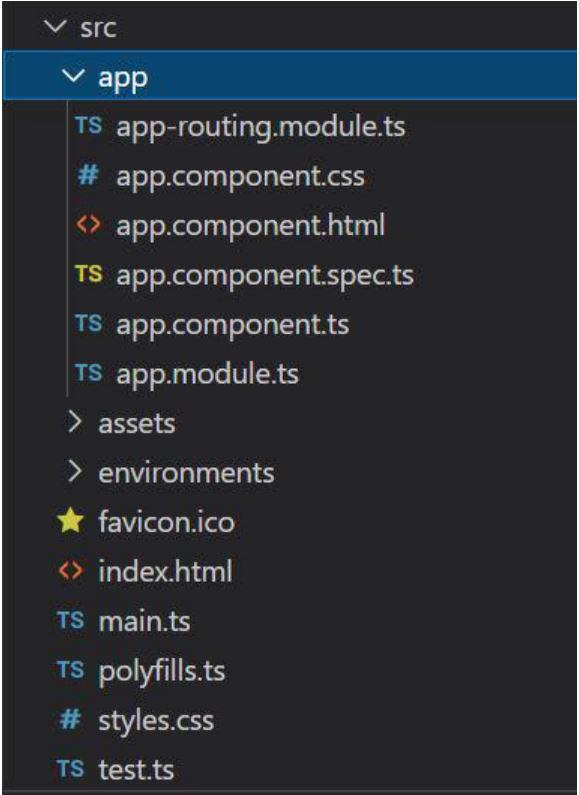
项目结构:它将看起来像如下。
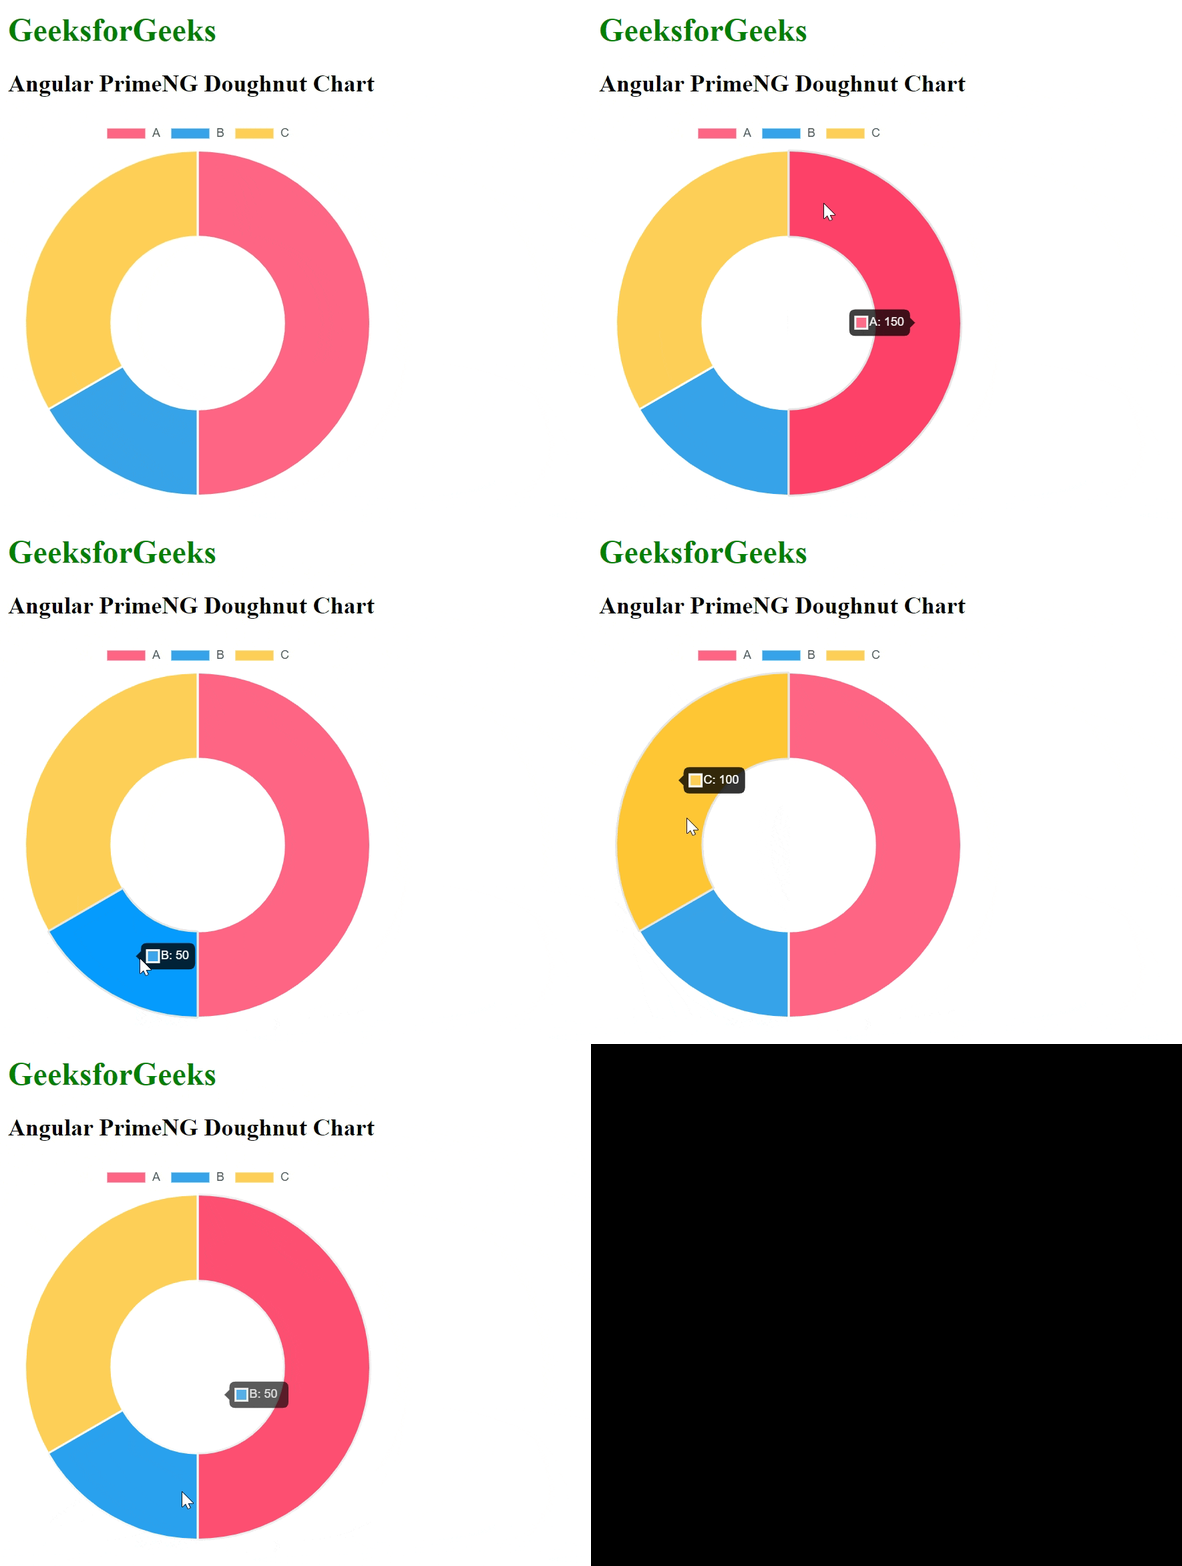
实例1:本实例介绍了Angular PrimeNG中的DoughnutChart组件。
- app.component.html
<div id="GFG">
    <h1 style="color:green">GeeksforGeeks</h1>
    <h2>Angular PrimeNG Doughnut Chart </h2>
    <div style="width:30%;">
        <p-chart type="doughnut"
                 [data]="data"
                 [options]="chartOptions">
        </p-chart>
    </div>
</div>
- app.component.ts
import { Component } from "@angular/core";

@Component({
  selector: "app-root",
  templateUrl: "./app.component.html",
  styleUrls: ["./app.component.css"],
})
export class AppComponent {
  title = "GFG";
  data = {
    labels: ["A", "B", "C"],
    datasets: [
      {
        data: [150, 50, 100],
        backgroundColor: ["#FF6384",
                          "#36A2EB",
                          "#FFCE56"],
      },
    ],
  };
  chartOptions = {
    plugins: {
      legend: {
        labels: {
          color: "#495057",
        },
      },
    },
  };
}
- app.module.ts
import { NgModule } from '@angular/core';
import { BrowserModule }
    from '@angular/platform-browser';
import { AppComponent } from './app.component';
import { ChartModule } from 'primeng/chart';


@NgModule({
    declarations: [
        AppComponent,

    ],
    imports: [
        BrowserModule,
        ChartModule
    ],
    providers: [],
    bootstrap: [AppComponent]
})
export class AppModule { }
输出:

实例2:本实例介绍了Angular PrimeNG中的DoughnutChart组件,我们将在Doughnut中创建悬停选项,还将添加更多数据集。
- app.component.html
<div id="GFG">
    <h1 style="color:green">GeeksforGeeks</h1>
    <h2>Angular PrimeNG Doughnut Chart </h2>
    <div style="width:30%;">
        <p-chart type="doughnut"
                 [data]="data"
                 [options]="chartOptions">
        </p-chart>
    </div>
</div>
- app.component.ts
import { Component } from '@angular/core';

@Component({
    selector: 'app-root',
    templateUrl: './app.component.html',
})
export class AppComponent {
    title = 'GFG';
    data = {
        labels: ['A', 'B', 'C', 'D'],
        datasets: [
            {
                data: [200, 150, 50, 100],
                backgroundColor: [
                    "#FF6384",
                    "#36A2EB",
                    "#FFCE56",
                    "green"
                ],
                hoverBackgroundColor: [
                    "#FF6384",
                    "#36A2EB",
                    "#FFCE56",
                    "lightgreen"
                ]

            }
        ]
    };
    chartOptions = {
        plugins: {
            legend: {
                labels: {
                    color: '#495057'
                }
            }
        }
    };
}
- app.module.ts
import { NgModule } from '@angular/core';
import { BrowserModule }
    from '@angular/platform-browser';
import { AppComponent } from './app.component';
import { ChartModule } from 'primeng/chart';


@NgModule({
    declarations: [
        AppComponent,

    ],
    imports: [
        BrowserModule,
        ChartModule
    ],
    providers: [],
    bootstrap: [AppComponent]
})
export class AppModule { }
输出:

 极客教程
极客教程