R语言 ggplot2中的主题
在这篇文章中,我们将学习ggplot2的主题系统,它是用来改变绘图的主题的。当人们想自定义图形的字体、刻度线和背景时,就会用到主题。在R编程语言中,主题系统主要由四个部分组成。
- 主题元素 – 这些是图形的非数据元素,如标题、刻度线等。
- 元素函数–元素函数用于更新和修改图形的元素。
- theme() 函数 – 用于通过覆盖绘图的现有主题来升级到新的主题。
- 完整的主题 – 当人们想要设计情节的背景时,就会用到这些主题。
让我们讨论一下最流行的基于主题的软件包 ggthemes , ggdark , hrbrthemes 。
GGTHEMES
安装并加载所需的软件包。
# Install required package
install.packages("ggplot2")
install.packages("ggthemes")

# Load the installed packages
library(ggplot2)
library(ggthemes)
让我们来解析一下ggthemes包中最常用的主题函数,如下。
- theme_base() – 类似于 “base “R图形的默认设置的heme
语法
theme_base(base_size = 16, base_family = “”)
其中
- base_size – 基本字体大小,单位为pts.(可选)
- base_family – 基本字体家族(可选)
# load the default iris dataset
data(iris)

# Plotting the density plot
ggplot2::ggplot(iris, aes(x = Sepal.Width,fill = Species)) +
geom_density(alpha = 0.7) +
ggthemes::theme_base() +
theme(legend.position = "top")
输出

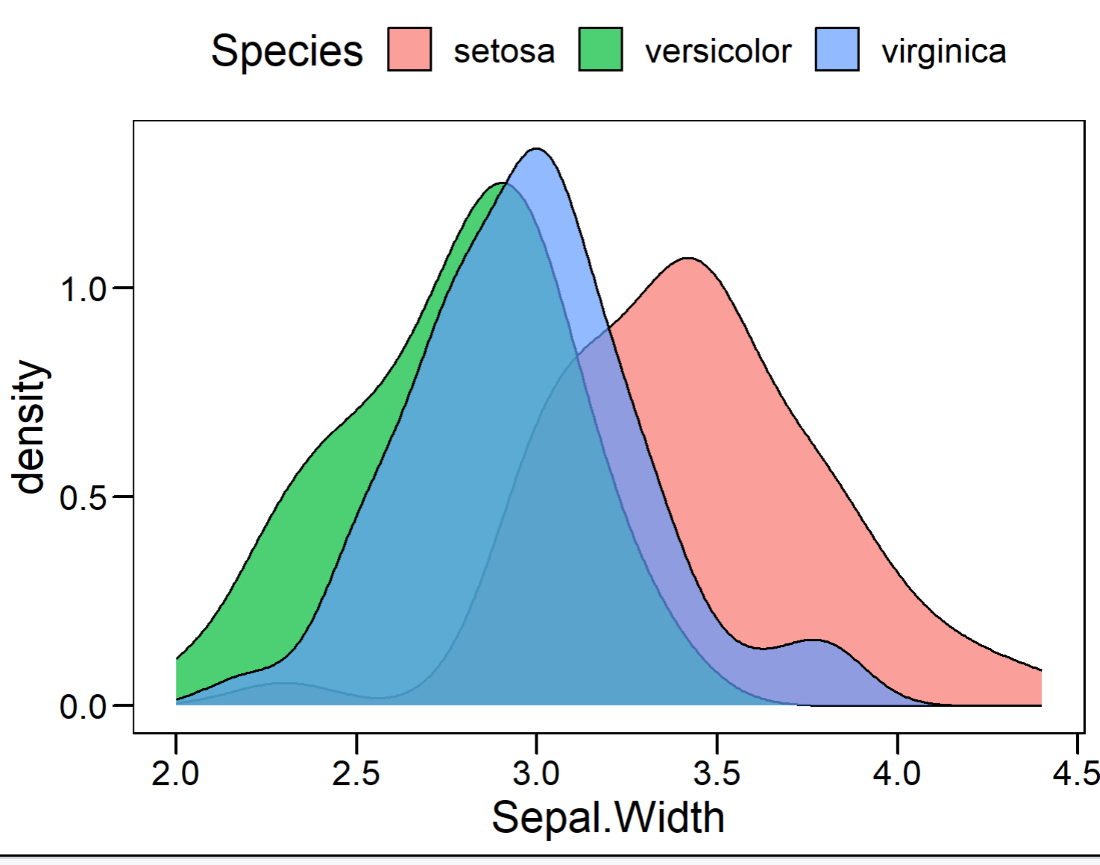
使用ggthemes的密度图
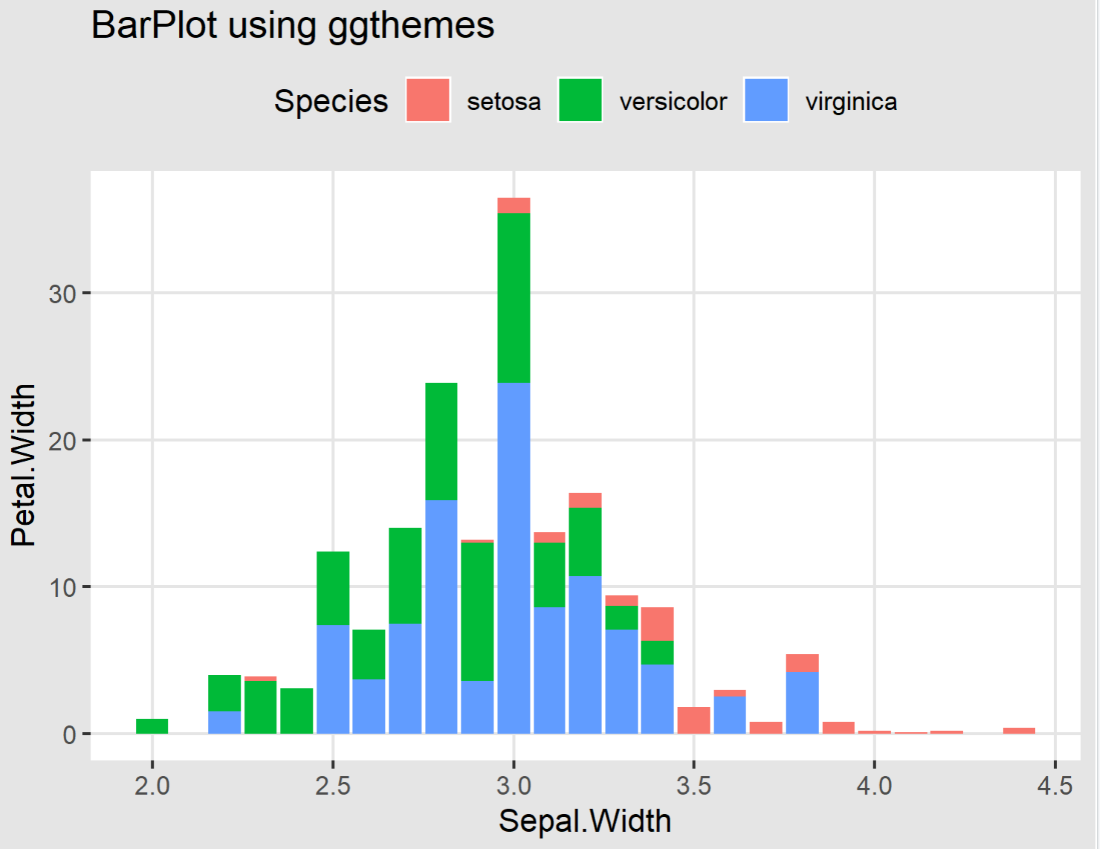
使用ggplot和ggtheme绘制条形图
- Inverse Gray Theme(theme_igray) – 带有白色面板和灰色背景的主题。
语法
theme_igray(base_size = 12, base_family = "_ ")
其中
- base_size – 基本字体大小,单位为pts。
- base_family – 基本字体家族
# load the default iris dataset
data(iris)

# Plotting the bar plot
ggplot2::ggplot(iris, aes(x = Sepal.Width,y=Petal.Width,
                        fill = Species)) +
geom_bar(stat="identity") +
ggthemes::theme_igray() +
theme(legend.position = "top")+
ggtitle("BarPlot using ggthemes")
输出

使用ggthemes和ggplot2绘制条形图
GGDARK
正如其名称所示,GGDARK是一个用于生成基于黑暗主题的绘图的包。通过应用这些函数,图的颜色被反转,以确保图是可见的。dark_mode()是ggdark包中的一个函数,用于激活黑暗模式。
语法
dark_mode(.theme = theme_get(), verbose = TRUE, force_geom_invert = FALSE)
其中
- theme – ggplot2主题对象
- verbose – 打印信息(默认:TRUE
- force_geom_invert – 强制反转geom默认的填充和颜色/色彩(默认:FALSE)
# Install required package
install.packages("ggdark")

# Load the installed packages
library(ggdark)

# load the default iris dataset
data(iris)

# Plotting the Points(Dot) Plot
plot<-ggplot2::ggplot(iris, aes(x = Sepal.Width,
                                y = Petal.Width,
                                  color = Species)) +
  geom_point() +
  ggthemes::theme_fivethirtyeight() +
  theme(legend.position = "top")+
  ggtitle("DotPlot using ggthemes")
plot<-plot+ggdark::dark_mode()
plot
输出

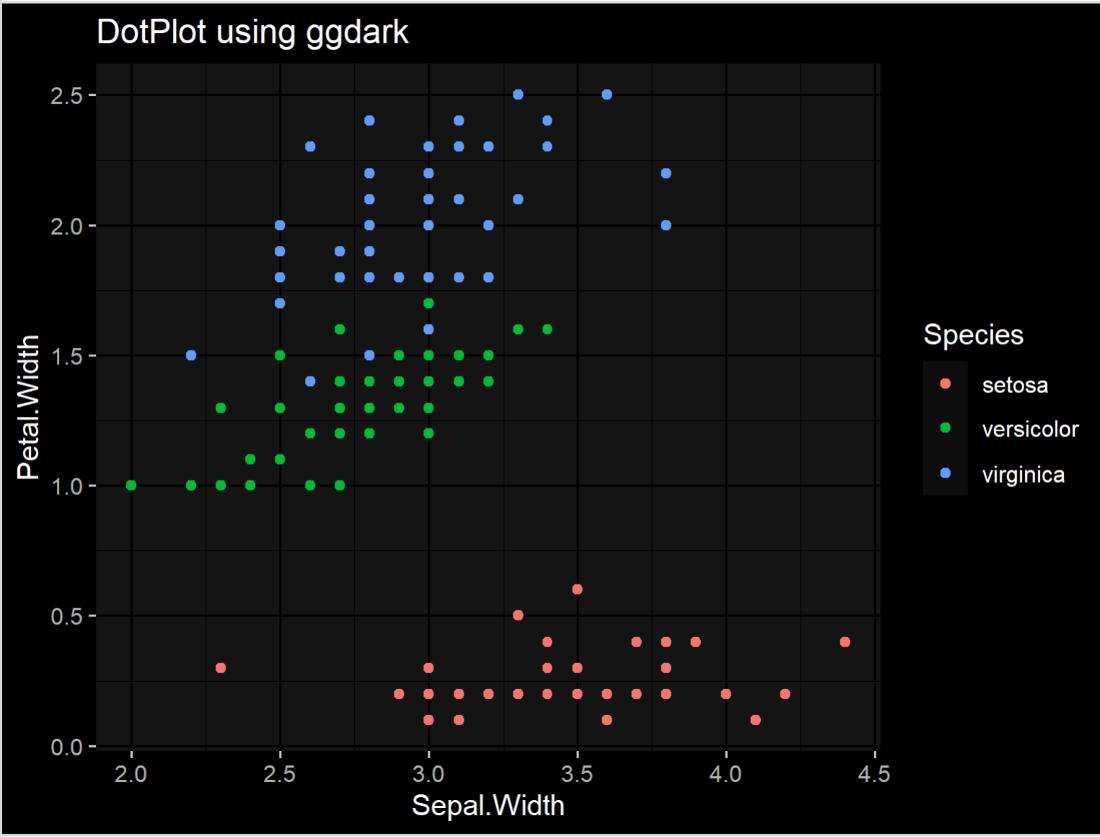
使用ggdark和ggplot2绘制散点图
HRBRTHEMES
hrbrthemes包是专门用来提供建立在ggplot2包之上的字体主题的。它包含了许多函数,可以产生如下的效果
- ipsum_pal() – 用来建立一个定性的调色板
- gg_check() – 用于检查绘图标签的拼写情况
- theme_ipsum_rc() – 用于生成精确和原始的图,并对排版进行优化的默认值
语法:
theme_ipsum_rc(base_family, base_size, plot_title, axis_title, plot_margin, grid, axis)
其中
- base_family , base_size – 基准家族和它的字体大小在此指定
- plot_title – 在这里指定情节标题家族
- axis_title – 轴标题的字体家族、字体和大小在这里指定。
- plot_margin – 在这里指定绘图的边距
- grid – 在这里指定面板的网格
- axis – 用于添加X或Y轴
# install required packages
install.packages("hrbrthemes")

#load the installed packages
library(hrbrthemes)

# seminal scatterplot
ggplot(mtcars, aes(mpg, wt)) +
  geom_point(aes(colour=mpg)) +
  labs(x="Fuel effiiency (mpg)", y="Weight (tons)",
       title="Seminal Scatterplot using hrbrthemes") +
  theme_ipsum_rc()
输出

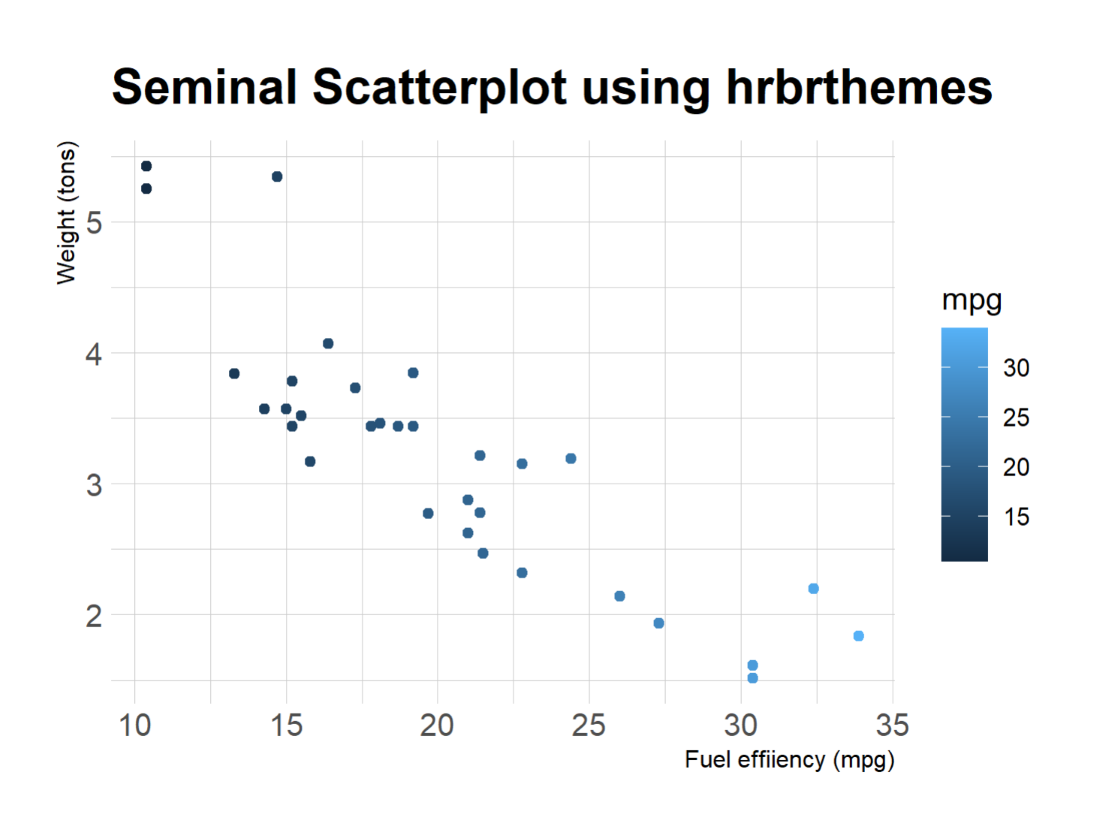
使用hrbrthemes和ggplot2绘制散点图
 极客教程
极客教程