Matplotlib.patches.Rectangle()
Python Rectangle(matplotlib.patches.Rectangle)类用于用来将矩形补丁打到左下角xy = (x, y)处,并指定宽度、高度和旋转角度。
语法:
matplotlib.patches.Rectangle(xy, width, height, angle=0.0, **kwargs)
参数:
- xy:开始绘制矩形的左下方点
- 宽度:矩形的宽度
- height:矩形的高度。
- angle:矩形的旋转角度。
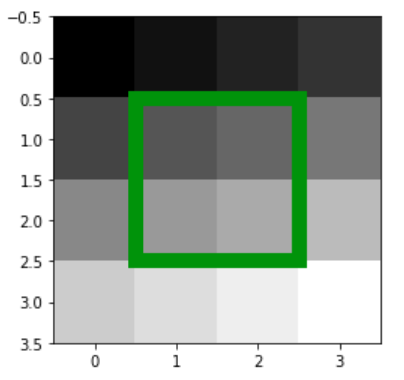
示例1
import numpy as np
import matplotlib.pyplot as plt
from matplotlib.patches import Rectangle


# The image
X = np.arange(16).reshape(4, 4)

# highlight some feature in the
# middle boxes.
fig = plt.figure()

ax = fig.add_subplot(111)
ax.imshow(X, cmap = plt.cm.gray,
          interpolation ='nearest')
ax.add_patch( Rectangle((0.5, 0.5),
                        2, 2,
                        fc ='none',
                        ec ='g',
                        lw = 10) )

plt.show()
输出:

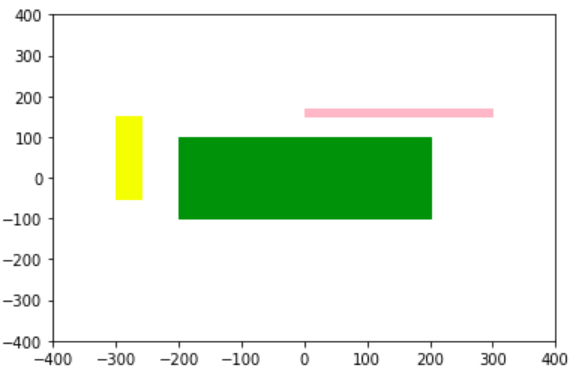
示例2
import matplotlib
import matplotlib.pyplot as plt


fig = plt.figure()
ax = fig.add_subplot(111)

rect1 = matplotlib.patches.Rectangle((-200, -100),
                                     400, 200,
                                     color ='green')

rect2 = matplotlib.patches.Rectangle((0, 150),
                                     300, 20,
                                     color ='pink')

rect3 = matplotlib.patches.Rectangle((-300, -50),
                                     40, 200,
                                     color ='yellow')

ax.add_patch(rect1)
ax.add_patch(rect2)
ax.add_patch(rect3)

plt.xlim([-400, 400])
plt.ylim([-400, 400])

plt.show()
输出:

 极客教程
极客教程