JavaScript 如何使用Google Sheets中的数据创建图表
本文将讨论如何使用来自Google表格的数据创建不同的图表。
要从Google表格导出数据,我们将使用SheetDB API。它将存储在Google电子表格中的数据转换为JSON格式的API。之后,我们将使用Fetch API将该JSON数据拉取到我们的文件中。一旦我们存储了数据,我们将使用Chart.js库绘制不同类型的图表。
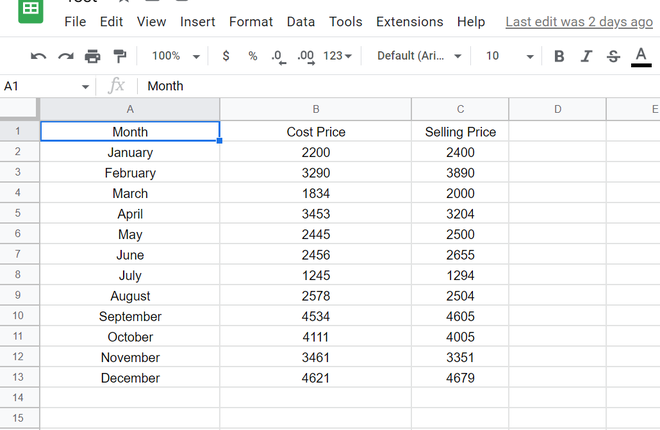
步骤1: 将Google表格数据转换为JSON数据。创建一个新的Google表格并插入一些数值数据。

保存该文件,然后转到“ 文件” 菜单 -> “ 共享” -> “ 与他人共享”。将一般访问权限更改为“ 任何拥有链接的互联网用户都可以查看”,并复制Google表的链接。
我们将使用Sheet DB API从此表获取数据。在此处创建一个新的免费API。在下面的输入框中输入您的Google表链接。

创建API后,您将会得到以下格式的API链接。
https://sheetdb.io/api/v1/[Your_API_URL]
访问该链接后,您可以看到Google Sheet数据已经转换为JSON格式。
示例:
[{"Month":"January","Cost Price":"2200","Selling Price":"2400"},
{"Month":"February","Cost Price":"3290","Selling Price":"3890"},
{"Month":"March","Cost Price":"1834","Selling Price":"2000"},
{"Month":"April","Cost Price":"3453","Selling Price":"3204"},
{"Month":"May","Cost Price":"2445","Selling Price":"2500"},
{"Month":"June","Cost Price":"2456","Selling Price":"2655"},
{"Month":"July","Cost Price":"1245","Selling Price":"1294"},
{"Month":"August","Cost Price":"2578","Selling Price":"2504"},
{"Month":"September","Cost Price":"4534","Selling Price":"4605"},
{"Month":"October","Cost Price":"4111","Selling Price":"4005"},
{"Month":"November","Cost Price":"3461","Selling Price":"3351"},
{"Month":"December","Cost Price":"4621","Selling Price":"4679"}]
步骤2:获取JSON数据: 创建一个新的HTML文件,并根据表格中的列数声明JS数组。使用Fetch API的fetch方法从我们在上一步中创建的API URL中获取JSON数据。然后迭代所有列的数据,并将其添加到相应的数组中。
Javascript
var apiUrl = 'https://sheetdb.io/api/v1/[Your_API_URL]';
var months=[]
var cost=[];
var selling=[];
fetch(apiUrl).then(response => {
    return response.json();
}).then(data => {
     for(let i =0; i <data.length;i++){
        months.push(data[i]['Month']);
        cost.push(parseInt(data[i]['Cost Price']));
        selling.push(parseInt(data[i]['Selling Price']));
    }
}).catch(err => {
      console.log(err);
});
步骤3:使用这些数据创建图表: 要从这些数据创建不同的图表,我们将使用Chart.js库。创建一个HTML画布,选择图表类型并传递您想要可视化的数据。
示例:
Javascript
<!DOCTYPE html>
<html lang="en">

<head>
    <meta charset="UTF-8">
    <meta http-equiv="X-UA-Compatible" content="IE=edge">
    <meta name="viewport" content="width=device-width, initial-scale=1.0">
    <title>Document</title>
    <link rel="stylesheet" href=
"https://cdn.jsdelivr.net/npm/bootstrap@4.0.0/dist/css/bootstrap.min.css"
          integrity=
"sha384-Gn5384xqQ1aoWXA+058RXPxPg6fy4IWvTNh0E263XmFcJlSAwiGgFAW/dAiS6JXm"
          rossorigin="anonymous">
    <script src=
          "https://code.jquery.com/jquery-3.2.1.slim.min.js"
            integrity=
"sha384-KJ3o2DKtIkvYIK3UENzmM7KCkRr/rE9/Qpg6aAZGJwFDMVNA/GpGFF93hXpG5KkN"
            crossorigin="anonymous">
    </script>
    <script src=
"https://cdn.jsdelivr.net/npm/bootstrap@4.0.0/dist/js/bootstrap.min.js"
            integrity=
"sha384-JZR6Spejh4U02d8jOt6vLEHfe/JQGiRRSQQxSfFWpi1MquVdAyjUar5+76PVCmYl"
            crossorigin="anonymous">
    </script>
    <script src=
"https://cdnjs.cloudflare.com/ajax/libs/Chart.js/2.9.4/Chart.js">
    </script>
</head>

<body>
    <center>
        <h3>Charts using Google Sheet Data</h3>
        <button class="btn btn-outline-success"
            onclick="plotcharts()">
            Plot Charts
        </button>
    </center>
    <div class="row" style="width:100%">
        <div class="col-md-6">
            <canvas id="barchart"></canvas>
        </div>
        <div class="col-md-6">
            <canvas id="linechart"></canvas>
        </div>
    </div>
</body>

<script type="text/javascript">
    function plotcharts(){
        var apiUrl = 'https://sheetdb.io/api/v1/ouyqi1r5eoa17';
        var months=[]
        var cost=[];
        var selling=[];
        fetch(apiUrl).then(response => {
            return response.json();
        }).then(data => {
            for(let i =0; i <data.length;i++){
                months.push(data[i]['Month']);
                cost.push(parseInt(data[i]['Cost Price']));
                selling.push(parseInt(data[i]['Selling Price']));
            }
            //For Bar chart
            dataset=addData('Cost Price', cost, 'green', 'black');
            drawchart(dataset, months, 'bar');

            //For Line chart
            dataset=addData('Selling Price', selling, 'transparent', 'green');
            drawchart(dataset, months, 'line');

        }).catch(err => {
            console.log(err);
        });
    }

    function addData(title, Data, bgcolor, bordercolor){
        return [{
            label: title,
            data: Data,
            backgroundColor: bgcolor,
            borderColor: bordercolor,
            borderWidth: 1.5
        }];
    }

    function drawchart(dataset, Labels, type){
        const ctx = document.getElementById(type+'chart').getContext('2d');
        const myChart = new Chart(ctx, {
            type: type,
            data: {
                labels: Labels,
                datasets: dataset
            },
            options: {
                scales: {
                    yAxes: [{
                        ticks: {
                            beginAtZero: true
                        }
                    }]
                }
            }
        });
    }
</script>

</html>
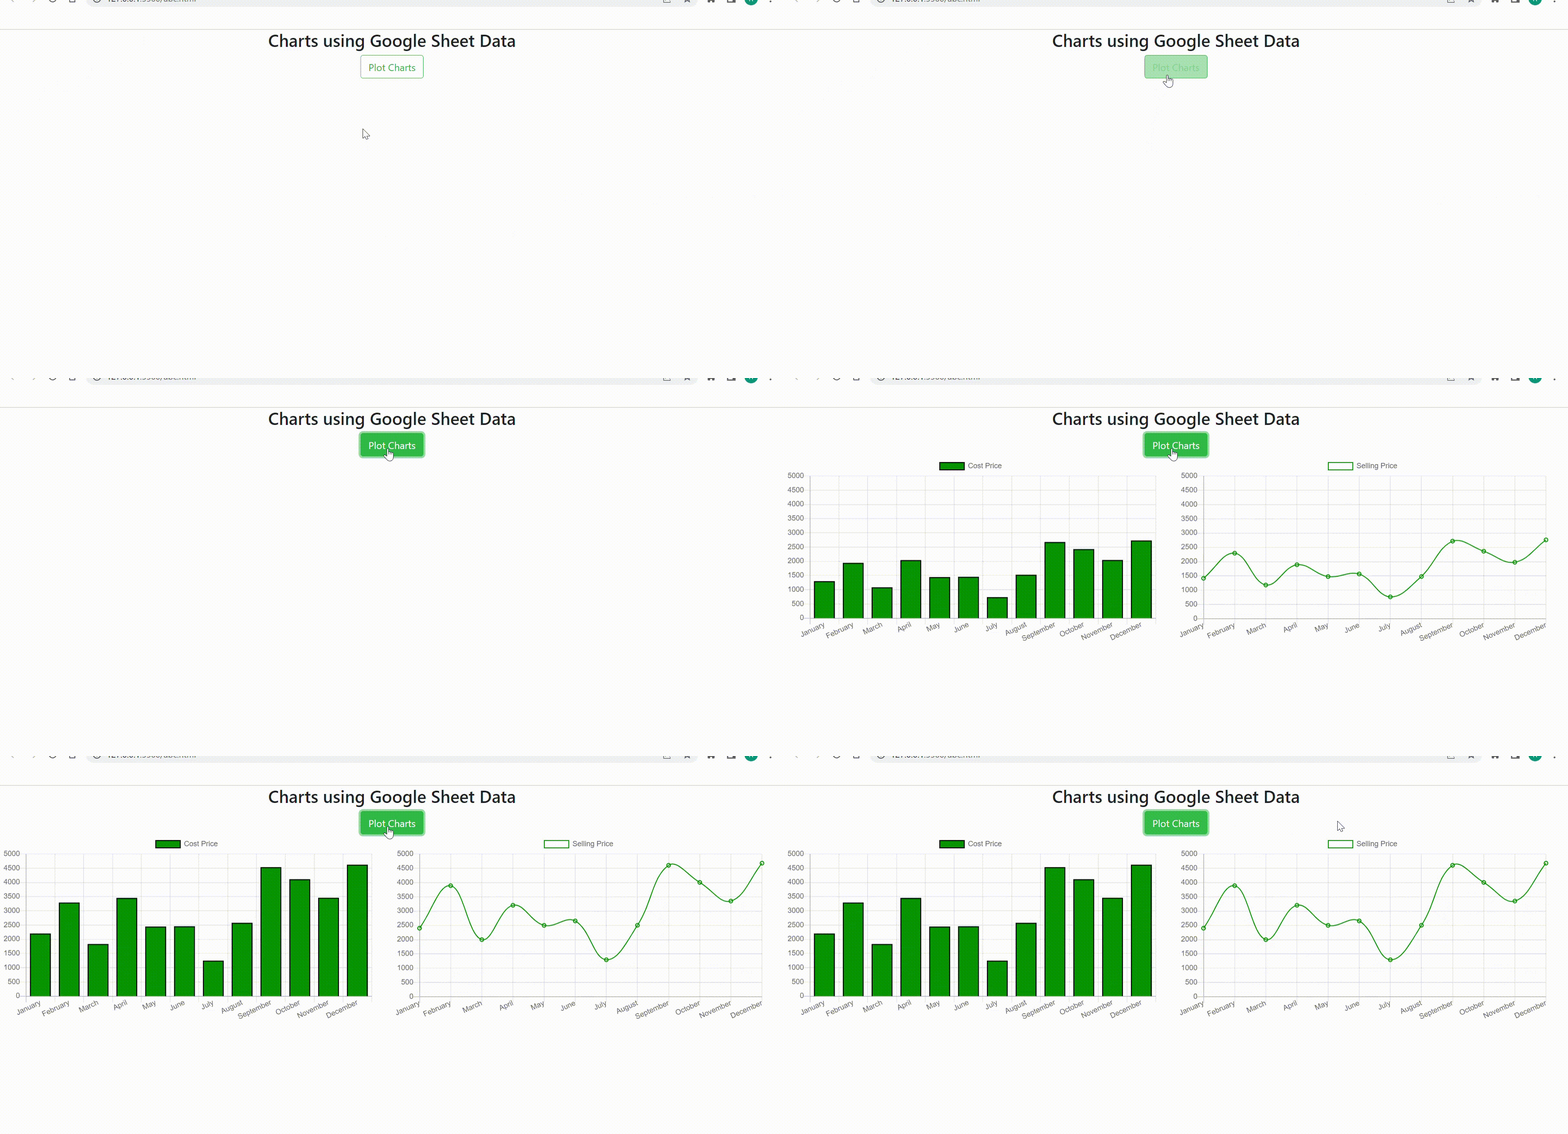
输出:

 极客教程
极客教程