如何使用CanvasJS实现Spline图表
在本文中,我们将学习使用Canvas JS插件实现单系列和多系列Spline图表的方法。
Spline图表可以定义为一种用于绘制时间相关变量的线图的类型。线图和spline图表的基本区别在于,spline图表上的点是通过平滑曲线连接的,而不是直线,这确保了可视化结果对分析师更加有信息性。
语法:
new CanvasJS.Chart($("#ID"), {
 data: [{
      type: "spline",
      dataPoints: [
            {...},
       ]
     },
  ]
 ....
});
做法:
- 在HTML设计中,使用
<div>标签展示所选图表。 - 在代码的 script 部分,使用语法通过设置库的 type, data, datapoints 和其他选项属性来实例化CanvasJS对象。
- 在代码的 head 部分包含CDN链接以使用插件的功能。
- 使用Canvas JS插件的render()方法呈现图表。
- 根据需求设置其他属性或样式以对图表进行样式化,如下面示例代码所示。
- 根据可用的数据创建图表以进行代码实现。
CDN链接:
<script src="https://cdnjs.cloudflare.com/ajax/libs/jquery/3.6.4/jquery.min.js"></script>
<script src="https://canvasjs.com/assets/script/canvasjs.min.js"></script>
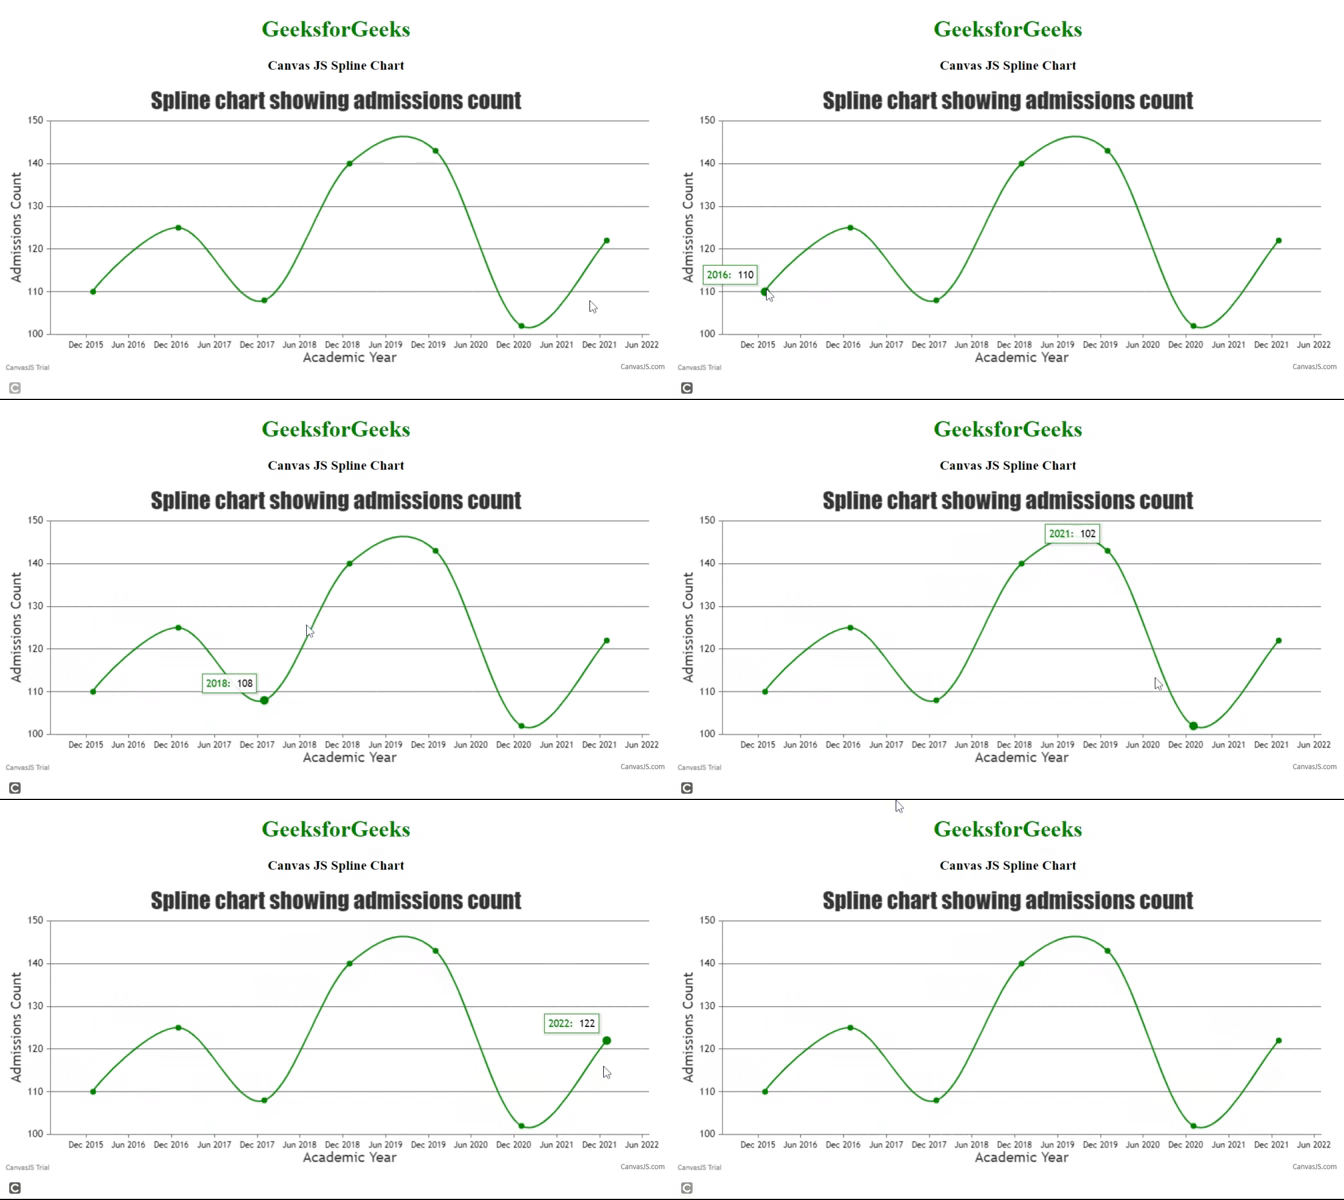
例子 1: 该例子展示了使用插件生成样条图。它展示了一段时间内(学年在 x 轴上)获得入学的学生数量(y 轴上)的平滑曲线。
HTML
<!DOCTYPE HTML>
<html>
<head>
    <script type="text/javascript" src=
"https://canvasjs.com/assets/script/canvasjs.min.js">
    </script>
</head>
<body>
    <div style="text-align:center">
        <h1 style="color:green">GeeksforGeeks</h1>
        <h3>Canvas JS Spline Chart </h3>
    </div>
    <div id="chartID"
         style="height:400px; max-width:950px;
            margin:0px auto;">
    </div>
    <script>
        window.onload = function () {
            var chart = new CanvasJS.Chart("chartID", {

                title:{
                    text: "Spline chart showing admissions count"
                },
                axisX:{
                    title: "Academic Year",

                },
                axisY:{
                    title: "Admissions Count",
                },
                data: [
                {
                    type: "spline",
                    xValueFormatString: "YYYY",
                    color:"green",
                    dataPoints: [
                        { x:new Date(2016, 0,01), y:110},
                        { x:new Date(2017, 0,01), y:125 },
                        { x:new Date(2018, 0,01), y:108},
                        { x:new Date(2019, 0,01), y:140},
                        { x:new Date(2020, 0,01), y:143},
                        { x:new Date(2021, 0,01), y:102 },
                        { x:new Date(2022, 0,01), y:122 }
                    ]// end dataPoints
                }
                ]// end data
            });
            chart.render();
        }// window onload
    </script>
</body>
</html>
输出:

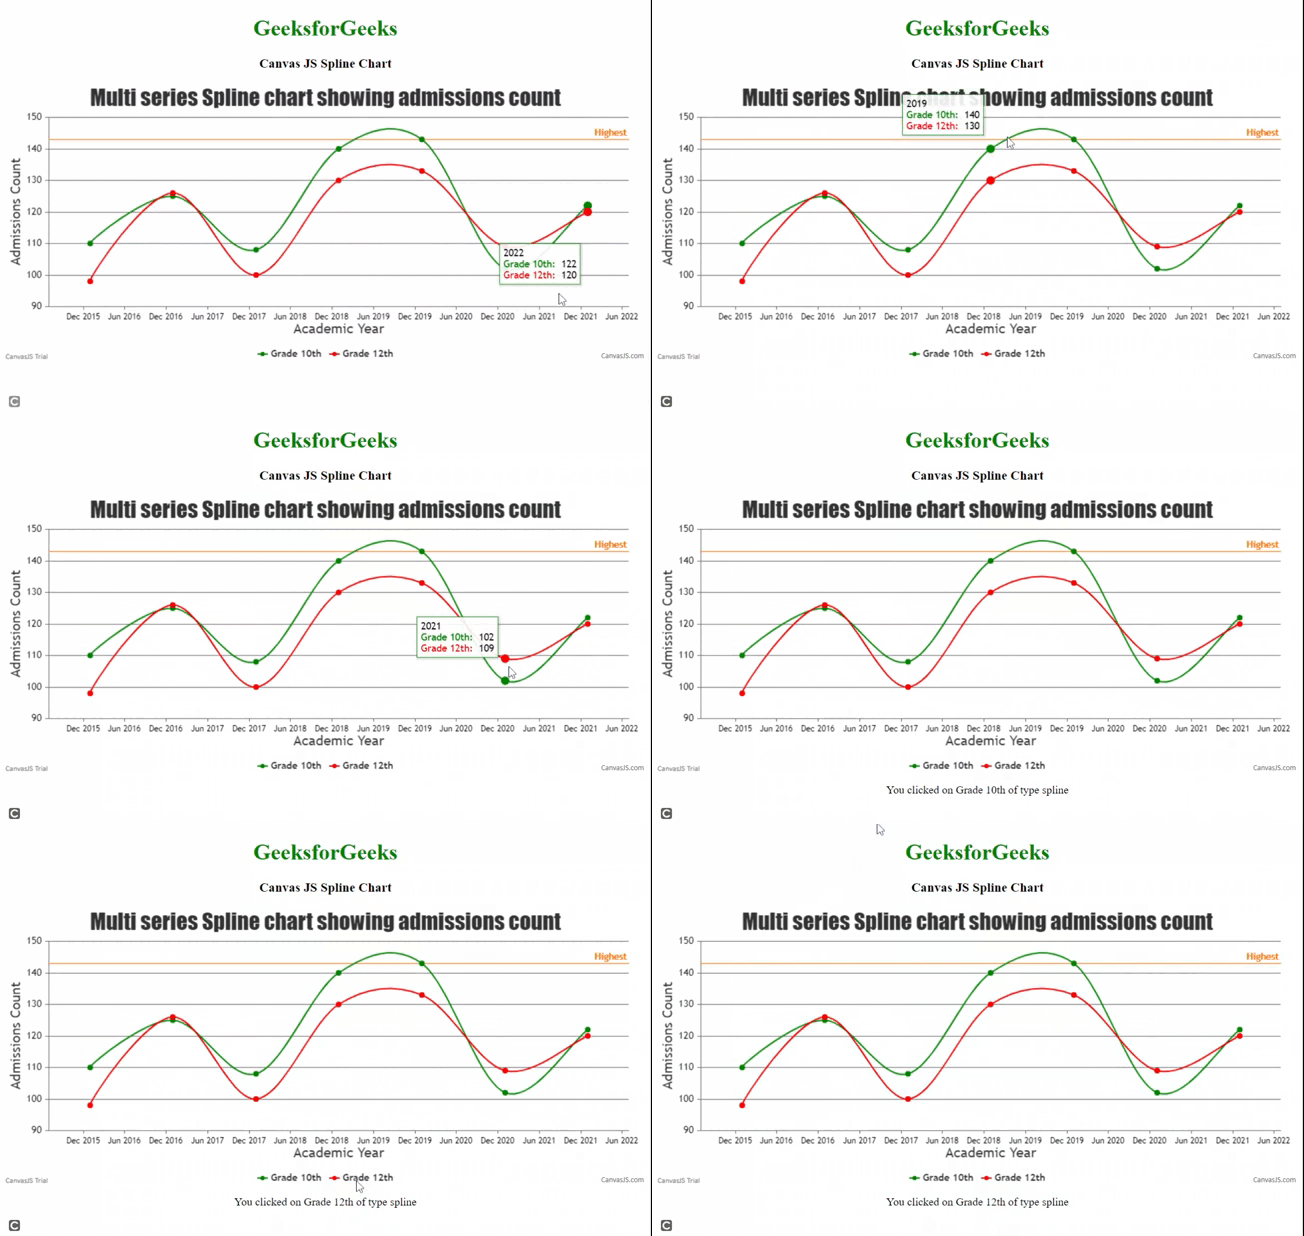
示例2: 该示例演示了使用插件的多系列样条图。它显示了在一段时间内(学术年度在x轴上)入学人数(y轴)的平滑曲线,包括10年级和12年级分开的平滑曲线。如你在代码中所见,两个年级的信息存储在不同的dataPoints中。还使用属性进行了其他样式设置,并处理了图例项的itemClick事件触发。
HTML
<!DOCTYPE HTML>
<html>
<head>
    <script type="text/javascript" src=
 "https://cdnjs.cloudflare.com/ajax/libs/jquery/3.6.4/jquery.min.js">
    </script>
    <script type="text/javascript" src=
"https://canvasjs.com/assets/script/canvasjs.min.js">
    </script>
</head>
<body>
    <div style="text-align:center">
        <h1 style="color:green">GeeksforGeeks</h1>
        <h3>Canvas JS Spline Chart </h3>
    </div>
    <div id="chartID"
         style="height:400px; max-width:950px;
            margin:0px auto;">
    </div>
    <div style="height:15px"></div>
    <div style="text-align:center" id="legendItemID">
    </div>

    <script>
        window.onload = function () {
            var chart = new CanvasJS.Chart("chartID", {

                title:{
                    text:
            "Multi series Spline chart showing admissions count"
                },
                axisX:{
                    title: "Academic Year",

                },
                axisY:{
                    title: "Admissions Count",
                    stripLines: [{
                        value: 143,

                        label: "Highest"
                    }]
                },
                toolTip: {
                    shared: "true"
                },
                legend: {
                    cursor:"pointer",
                    itemclick: function(e){

                         $("#legendItemID").show().html(
                         "You clicked on "
                         +e.dataSeries.name+ " of type "
                         + e.dataSeries.type);
                    }
                },
                data: [
                {
                    type: "spline",
                    xValueFormatString: "YYYY",
                    showInLegend: true,
                    name: "Grade 10th",
                    color:"green",
                    lineThickness: 2,
                    dataPoints: [
                        { x:new Date(2016, 0,01), y:110},
                        { x:new Date(2017, 0,01), y:125 },
                        { x:new Date(2018, 0,01), y:108},
                        { x:new Date(2019, 0,01), y:140},
                        { x:new Date(2020, 0,01), y:143},
                        { x:new Date(2021, 0,01), y:102 },
                        { x:new Date(2022, 0,01), y:122 }

                    ]// end dataPoints
                },
                {
                    type: "spline",
                    xValueFormatString: "YYYY",
                    showInLegend: true,
                    lineThickness: 2,
                    name: "Grade 12th",
                    color:"red",
                    dataPoints: [
                        { x:new Date(2016, 0,01), y:98},
                        { x:new Date(2017, 0,01), y:126 },
                        { x:new Date(2018, 0,01), y:100},
                        { x:new Date(2019, 0,01), y:130},
                        { x:new Date(2020, 0,01), y:133},
                        { x:new Date(2021, 0,01), y:109 },
                        { x:new Date(2022, 0,01), y:120 }

                    ]// end dataPoints
                },

                ]// end data
            });
            chart.render();
        }// window onload
    </script>
</body>
</html>
输出:

结论: 样条图可用于绘制需要使用平滑曲线拟合的数据。每当开发人员需要显示一些依赖于时间相关变量的数据趋势时,他需要实现样条图。如果要显示多个类别,请使用多系列样条图来显示多个时间相关变量的图形表示。
 极客教程
极客教程