在Python中使用TensorFlow为时装MNIST数据集建立模型
主要目标是建立一个分类模型,能够使用Tensorflow和Keras从时尚MNIST数据集中识别出时尚行业的不同类别。
为了完成我们的目标,我们将创建一个CNN模型来识别图像类别,并在数据集上对其进行训练。我们使用深度学习作为选择方法,因为数据集由图像组成,而CNN一直是图像分类任务的首选算法。我们将使用Keras来创建CNN,并使用Tensorflow来完成数据操作任务。
该任务将分为三个步骤:数据分析、模型训练和预测。让我们从数据分析开始。
数据分析
第1步:导入所需的库。
我们将首先导入所有需要的库来完成我们的目标。为了显示图像,我们将使用matplotlib,而对于数组操作,我们将使用NumPy。Tensorflow和Keras将被用于ML和深度学习的东西。
# To load the mnist data
from keras.datasets import fashion_mnist
from tensorflow.keras.models import Sequential

# importing various types of hidden layers
from tensorflow.keras.layers import Conv2D, MaxPooling2D,\
Dense, Flatten

# Adam optimizer for better LR and less loss
from tensorflow.keras.optimizers import Adam
import matplotlib.pyplot as plt
import numpy as np
时尚的MNIST数据集在keras.dataset库中很容易获得,所以我们只是从那里导入了它。
该数据集由70,000张图像组成,其中60,000张用于训练,其余用于测试。这些图像是灰度格式的。每张图片由28×28像素组成,类别的数量为10。因此,我们有10个可用的标签,它们是:。
- T-shirt/top
- Trouser
- Pullover
- Dress
- Coat
- Sandal
- Shirt
- Sneaker
- Bag
- Ankle boot
第2步:加载数据并将其自动分割成训练和测试。
我们将使用load_dataset函数加载数据。它将为我们提供上面提到的训练和测试数据集。
# Split the data into training and testing
(trainX, trainy), (testX, testy) = fashion_mnist.load_data()

# Print the dimensions of the dataset
print('Train: X = ', trainX.shape)
print('Test: X = ', testX.shape)
训练包含来自60,000张图像的数据,而测试包含来自10,000张图像的数据。
第3步:将数据可视化。
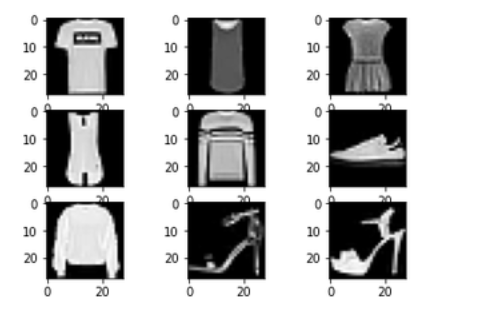
由于我们已经加载了数据,我们将对其中的一些样本图像进行可视化。为了查看这些图像,我们将使用迭代器来迭代,并在Matplotlib中绘制图像。
for i in range(1, 10):

    # Create a 3x3 grid and place the
    # image in ith position of grid
    plt.subplot(3, 3, i)

    # Insert ith image with the color map 'grap'
    plt.imshow(trainX[i], cmap=plt.get_cmap('gray'))

# Display the entire plot
plt.show()

至此,我们已经走到了数据分析的尽头。现在我们将转入模型训练。
模型训练
第1步:创建一个CNN架构。
我们将从头开始创建一个基本的CNN架构来对图像进行分类。我们将使用3个卷积层,以及3个最大集合层。最后,我们将添加一个有10个节点的softmax层,因为我们有10个标签需要识别。
def model_arch():
    models = Sequential()

    # We are learning 64
    # filters with a kernal size of 5x5
    models.add(Conv2D(64, (5, 5),
                      padding="same",
                      activation="relu",
                      input_shape=(28, 28, 1)))

    # Max pooling will reduce the
    # size with a kernal size of 2x2
    models.add(MaxPooling2D(pool_size=(2, 2)))
    models.add(Conv2D(128, (5, 5), padding="same",
                      activation="relu"))

    models.add(MaxPooling2D(pool_size=(2, 2)))
    models.add(Conv2D(256, (5, 5), padding="same",
                      activation="relu"))

    models.add(MaxPooling2D(pool_size=(2, 2)))

    # Once the convolutional and pooling
    # operations are done the layer
    # is flattened and fully connected layers
    # are added
    models.add(Flatten())
    models.add(Dense(256, activation="relu"))

    # Finally as there are total 10
    # classes to be added a FCC layer of
    # 10 is created with a softmax activation
    # function
    models.add(Dense(10, activation="softmax"))
    return models
现在我们将看到模型的总结。要做到这一点,我们将首先编译我们的模型,并将损失设定为稀疏分类交叉熵和度量,作为稀疏分类的准确性。
model = model_arch()

model.compile(optimizer=Adam(learning_rate=1e-3),
              loss='sparse_categorical_crossentropy',
              metrics=['sparse_categorical_accuracy'])

model.summary()

Model summary
第2步:在模型上训练数据。
由于我们已经编译了模型,我们现在将训练我们的模型。为此,我们将使用mode.fit()函数,并将epochs设置为10。我们还将进行33%的验证分割,以获得更好的测试精度,并使损失最小。
history = model.fit(
    trainX.astype(np.float32), trainy.astype(np.float32),
    epochs=10,
    steps_per_epoch=100,
    validation_split=0.33
)
第3步:保存模型。
我们现在将把模型保存为.h5格式,这样它就可以与任何网络框架或任何其他开发领域捆绑在一起。
model.save_weights('./model.h5', overwrite=True)
第4步:绘制训练和损失函数。
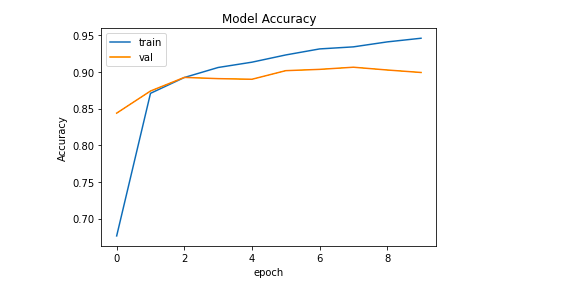
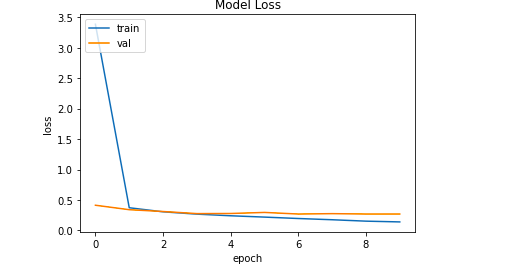
训练函数和损失函数是任何ML项目中的重要函数。它们告诉我们模型在多少个epochs下的表现,以及模型实际上需要多少时间来收敛。
# Accuracy vs Epoch plot
plt.plot(history.history['sparse_categorical_accuracy'])
plt.plot(history.history['val_sparse_categorical_accuracy'])
plt.title('Model Accuracy')
plt.ylabel('Accuracy')
plt.xlabel('epoch')
plt.legend(['train', 'val'], loc='upper left')
plt.show()
输出:

# Loss vs Epoch plot
plt.plot(history.history['loss'])
plt.plot(history.history['val_loss'])
plt.title('Model Accuracy')
plt.ylabel('loss')
plt.xlabel('epoch')
plt.legend(['train', 'val'], loc='upper left')
plt.show()
输出:

预测结果
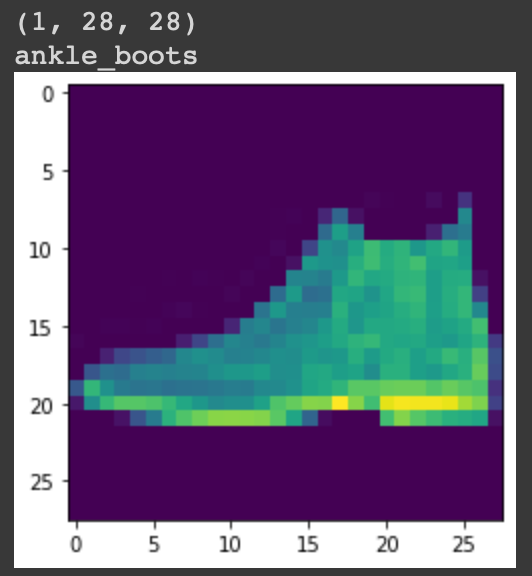
现在我们将使用model.predict()来获得预测结果。它将返回一个大小为10的数组,由标签的概率组成。标签的最大概率将是答案。
# There are 10 output labels for the
# Fashion MNIST dataset
labels = ['t_shirt', 'trouser', 'pullover',
          'dress', 'coat', 'sandal', 'shirt',
          'sneaker', 'bag', 'ankle_boots']

# Make a prediction
predictions = model.predict(testX[:1])
label = labels[np.argmax(predictions)]

print(label)
plt.imshow(testX[:1][0])
plt.show()
输出:

 极客教程
极客教程