R语言 绘制概率分布函数
PDF是概率分布函数的首字母缩写,CDF是累积分布函数的首字母缩写。一般来说,R语言中有许多概率分布函数,本文将重点介绍其中的正态分布来绘制PDF。
要计算正态分布函数,我们有内置函数dnorm(),要计算CDF,我们有R编程语言中的ecdf()。
语法
PDF: dnorm(x,mean,sd)
CDF: ecdf(x)
其中。
- x – 数据向量
- mean – 要计算的数据的平均值,或者可以分配给一个值
- sd–要计算的数据的标准差,也可以指定一个值
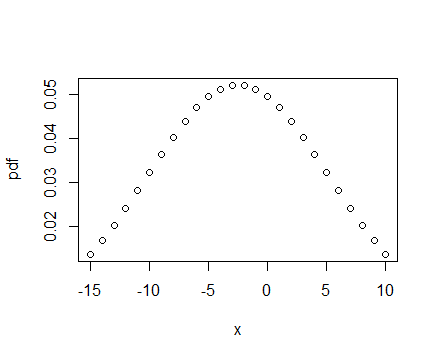
使用 plot() 函数来绘制 PDF
在这里,我们将使用dnom()函数来计算基于数据的平均值和标准差的正态分布。
# Generating sequence of
# numbers from -15 to +10
x<-seq(-15,10)

# calculate the Normal distribution function
# based on the mean and sd of data
pdf<- dnorm(x,mean(x),sd(x))

# Plotting the PDF(Normal Distribution Function
plot(x,pdf)
输出

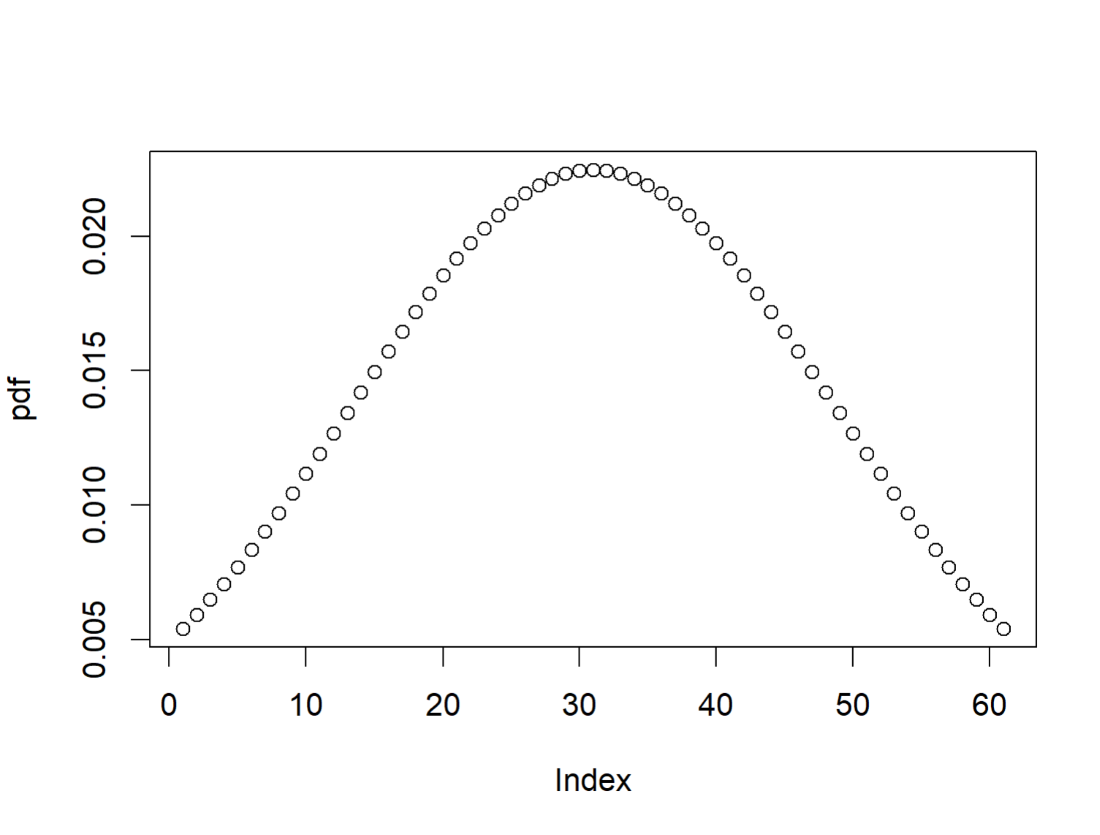
使用plotpdf()函数来绘制PDF
plotpdf()是gbutils软件包中的一个函数。
# install gbutils package
install.packages("gbutils")
plotpdf()函数用于在Y轴上绘制PDF,在X轴上绘制分布的量纲。
语法: plotpdf(pdf, qdf, lq, uq)
其中
- pdf – 这里指定要绘制的概率分布函数
- qdf – 要使用的量化函数,在此指定
- lq – 在计算中需要使用下四分位数
- uq – 计算中需要使用的上四分位数
# Load the installed package
library(gbutils)

# Generating sequence of numbers from -50 to +10
x<-seq(-50,10)

# Calculate the Normal distribution
# function based on the mean and sd of data
pdf<- dnorm(x,mean(x),sd(x))

# Calculate the Quantile distribution
# function based on the mean and sd of data
qdf <- function(x) qnorm(x, mean(x), sd(x))

# Plotting the PDF Normal Distribution Function
gbutils::plotpdf(pdf,qdf,lq=0.0001,uq=0.0009)
输出

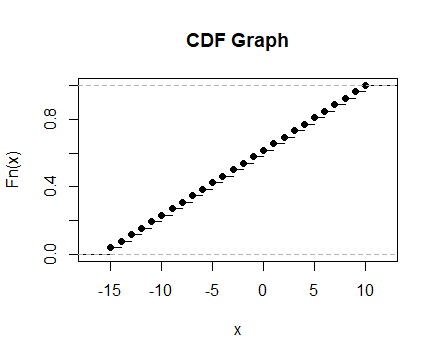
使用plot()函数来绘制CDF
在这里,我们将使用ecdf()函数来计算基于数据的平均值和标准偏差的累积分布。
# Generating sequence of
# numbers from -15 to +10
x<-seq(-15,10)

# calculate the Cumulative distribution
# function based on the mean and sd of data
cdf<-ecdf(x)

# Plotting the CDF
plot(cdf,xlabel="x",ylabel="y",main="CDF Graph")
输出

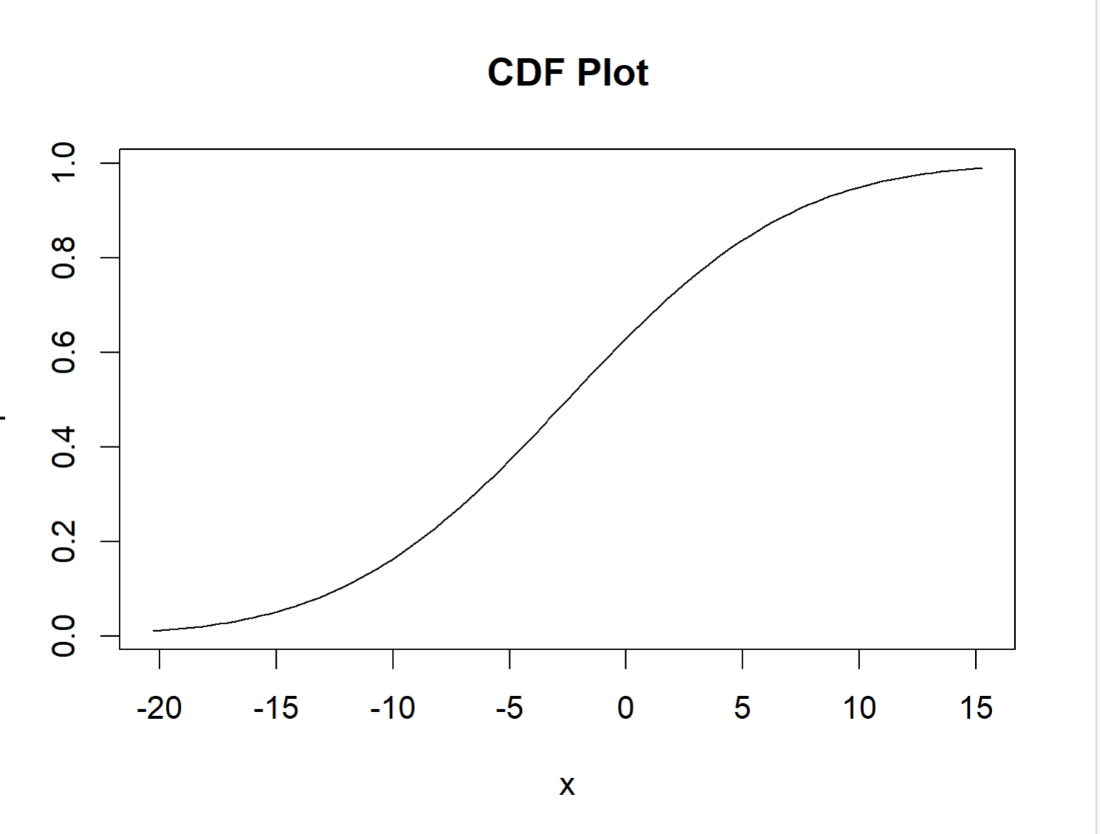
使用plotpdf()函数来绘制CDF
plotpdf()是gbutils包中的一个函数。这个包是专门为模拟R编程中的量化图而开发的。 plotpdf()函数用于绘制CDF。
语法: plotpdf(pdf, qdf, lq, uq)
其中
- cdf – 这里指定要绘制的Cummulative Density。
- qdf – 要使用的量化函数,在此指定
- lq – 计算中需要使用的下限四分位数
- uq – 计算中需要使用的上四分位数
# install and load the gbutils package
install.packages("gbutils")
library(gbutils)

# Calculating the CDF Normal Distribution Function
cdf1 <- function(x)pnorm(x, mean = -2.5, sd = 7.64)

# Plotting the CDF Normal Distribution Function
gbutils::plotpdf(cdf1, cdf = cdf1,main='CDF Plot')
输出

 极客教程
极客教程