R语言 在同一个图形上绘制多个曲线段
R是一种用于统计计算和图形的编程语言和软件环境。它在统计学家和数据科学家中被广泛用于开发统计软件和数据分析。
R编程语言以其强大和灵活的数据可视化能力而闻名。R的基本安装包括几个用于创建基本绘图和图表的库,如 “基础 “图形库和 “网格 “库。此外,还有许多其他可用于R的库,提供额外的可视化能力,如 “ggplot2 “库,它在创建复杂和高度可定制的可视化方面特别受欢迎。
绘制抛物线函数
library(ggplot2)

# Create sample data
x <- 1:10
y <- x^2

# Plot data using ggplot2
ggplot(data = data.frame(x, y)) +
  geom_line(aes(x = x, y = y)) +
  ggtitle("Curve Plot") +
  xlab("X values") +
  ylab("Y values")
输出
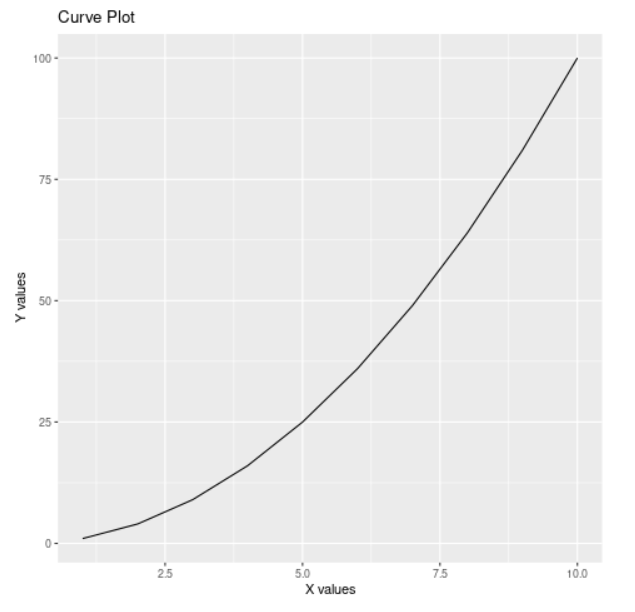
抛物线曲线是一个单曲线段
曲线段
R语言中的 “曲线段 “通常指的是一个连续函数的一部分,它定义在一个特定的X值区间内。它是将一条曲线或函数分解成较小的、可管理的部分的一种方式,对于理解一条曲线在不同区域的表现非常有用。
在R语言中, xlim 和 ylim 是用来设置 x 轴和 y 轴的界限的,当创建一个图时。 xlim 和 ylim 可以被传递给 plot() 函数或 ggplot2 库中的 coord_cartesian() 函数,它们可以用来放大图中的特定部分或去除可能使图发生倾斜的异常值。下面的输出显示了使用2条不同颜色的曲线形成的圆。
# Set up the plot
plot(0,0, xlim=c(-1.5,1.5), ylim=c(-1.5,1.5),
     xlab="x", ylab="y", main="Circle")

# Define the radius of the circle
r = 1

# Define the x and y values
# for the top half of the circle
x1 = seq(-r,r,length.out=100)
y1 = sqrt(r^2-x1^2)

# Define the x and y values for
# the bottom half of the circle
x2 = seq(-r,r,length.out=100)
y2 = -sqrt(r^2-x2^2)

# Plot the top half of the circle in red
lines(x1,y1, col="red")

# Plot the bottom half of the circle in blue
lines(x2,y2, col="blue")

# Add a legend to the plot
legend("topright", c("Top Half", "Bottom Half"),
       lty=1, col=c("red", "blue"))
输出
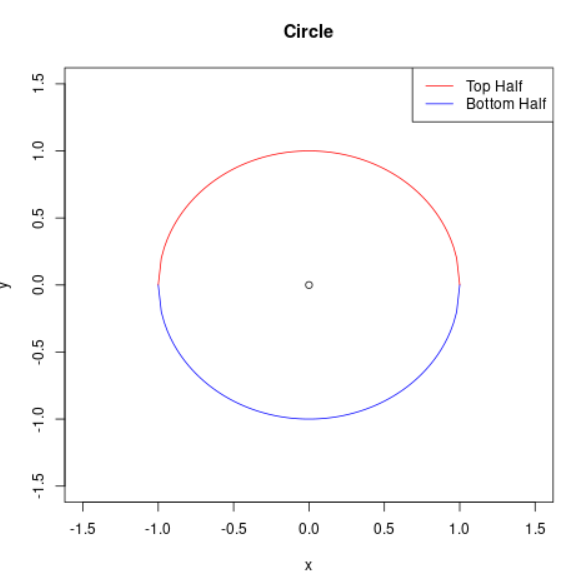
使用两个不同的片段形成的圆
下面是使用循环语句产生的输出。
# Set up the plot
plot(1:10, type="n")

# Set up the colors
colors <- c("red", "orange", "yellow", "green",
            "blue", "purple", "pink", "brown",
            "gray", "black")

# Loop through the colors and plot each curve
for (i in 1:10) {
  curve(sin(x+i), add=TRUE, col=colors[i])
}
输出
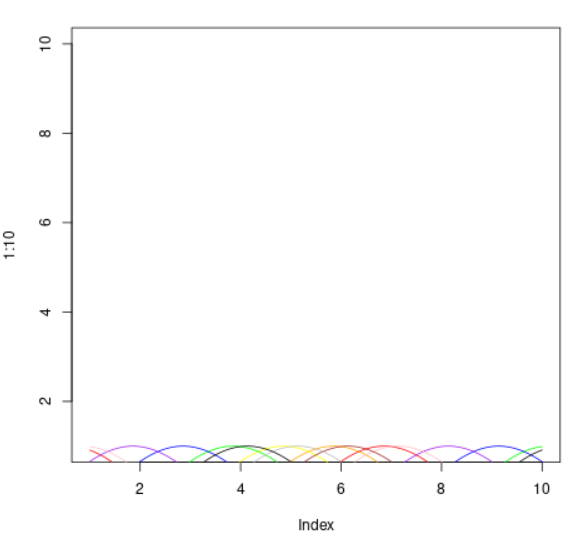
在同一个图形上有多条正弦曲线
现在让我们分别绘制1到10和11到20的y = x2 和y = x3 的图形。这样,我们就能在同一张图上绘制两条曲线段。
# Create data for curve segments
x1 <- 1:10
y1 <- x1^2
x2 <- 11:20
y2 <- x1^3

# Plot curve segments on the same graph
plot(x1, y1, type = "l", col = "blue",
     lwd = 2, xlim = c(0, 20), ylim = c(0, 1000))
lines(x2, y2, col = "red", lwd = 2)

# Add legend and labels
legend("topright", c("Curve 1", "Curve 2"),
       col = c("blue", "red"), lty = 1, lwd = 2)
xlab("X-axis")
ylab("Y-axis")
输出
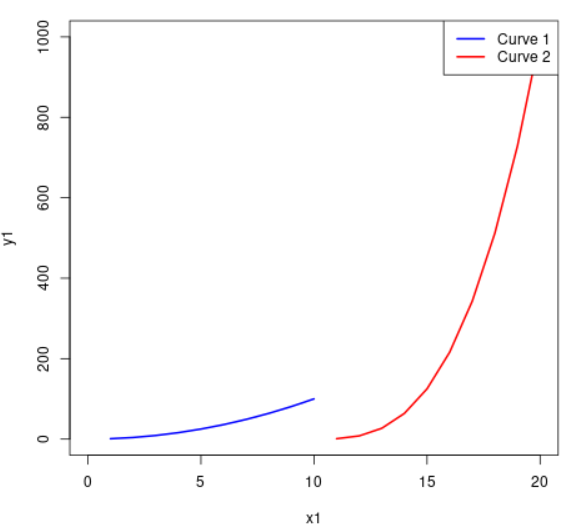
同一图形上的两个曲线段
在R中, seq() 是一个生成数字序列的函数。它需要三个参数:序列中的第一个和最后一个数字,以及数字之间的步长。
sin() 、 cos() 和 tan() 是三角函数,通常在处理曲线时使用。它们分别用于计算一个角度的正弦、余弦和正切。角度可以用弧度或度来指定,这取决于上下文。
例如,你可以使用 seq() 函数来创建一个x值序列,并使用三角函数来计算相应的y值来绘制一条曲线。
# Define the range of x values
x <- seq(0, 10, 0.1)

# Create a vector of y values for each curve
y1 <- sin(x)
y2 <- cos(x)
y3 <- tan(x)
y4 <- exp(x)
y5 <- log(x)
y6 <- sin(x) + cos(x)
y7 <- sin(x) + tan(x)
y8 <- cos(x) + tan(x)
y9 <- exp(x) + log(x)
y10 <- sin(x) + cos(x) + tan(x)

# Define a vector of colors for each curve
colors <- c("red", "orange", "yellow", "green",
            "blue", "purple", "pink", "brown",
            "gray", "black")

# Create a plot with multiple lines
plot(x, y1, type="l", col=colors[1])
lines(x, y2, col=colors[2])
lines(x, y3, col=colors[3])
lines(x, y4, col=colors[4])
lines(x, y5, col=colors[5])
lines(x, y6, col=colors[6])
lines(x, y7, col=colors[7])
lines(x, y8, col=colors[8])
lines(x, y9, col=colors[9])
lines(x, y10, col=colors[10])

# Add a legend to the plot
legend("topleft", c("Curve 1", "Curve 2", "Curve 3",
                    "Curve 4", "Curve 5", "Curve 6",
                    "Curve 7", "Curve 8", "Curve 9",
                    "Curve 10"),
       col=colors, lty=1)
输出
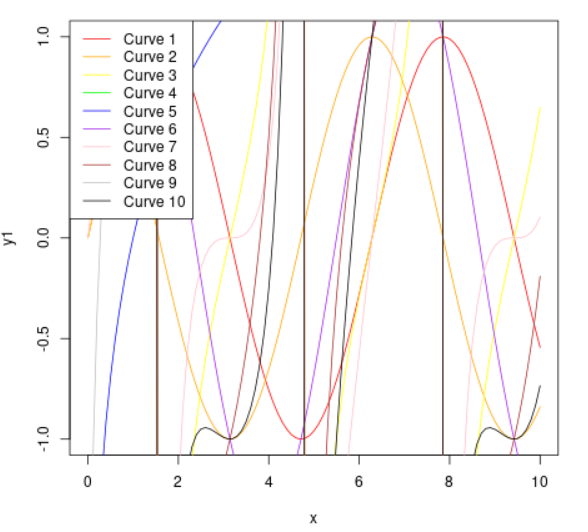
在同一个图形上的多个曲线段
 极客教程
极客教程