R语言 使用ggplot2创建关于两个因素的Bowxplot
ggplot2允许我们快速创建漂亮的boxplots。一个感兴趣的变量有可能有多个子组。在这些情况下,使用 “分组的boxplots “进行可视化是非常有用的。R编程语言中的ggplot2包提供了许多选项,用于可视化这种分组的boxplots。
现在谈一谈Boxplot,那么每个boxplot都是为该因素中的每个类别或水平创建的,该因素由一个因素和一个数字列表示。当有两个因素时,geom_boxplot还允许我们使用填充参数绘制两个因素。Geom_boxplot()是关键函数
语法:
geom_boxplot(width,notch,color,size,lineetype, fill,outliner.color, outliner.size, outliner.shape)
参数
- width: 波谱图的宽度
- notch:如果为真,那么它将创建一个有缺口的boxplot,缺口用于比较boxplot。
- color, size,line type:边界线、颜色、大小和形状。
- fill:用于填充箱形图区域。
- outlier.颜色、outlier.形状、outlier.大小。离群点的颜色、形状和大小。
现在让我们来看看一些实现方法。
例1 :
# create a Data Frame
Gender<-sample(c("Male","Female"),20,replace=TRUE)
Values<-rnorm(20,mean=0,sd=1)
Group<-sample(letters[1:5],20,replace=TRUE)

df<-data.frame(Gender,Values,Group)

library(ggplot2)

# creating a boxplot
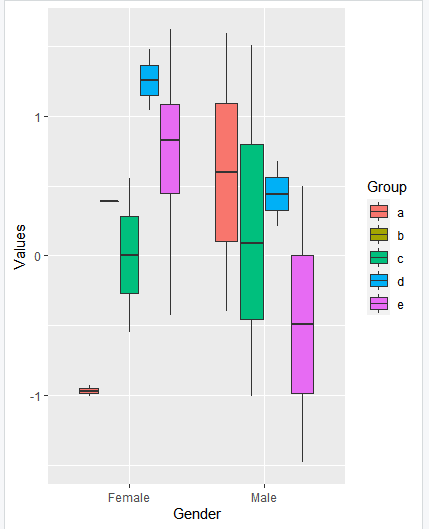
ggplot(df,aes(Gender,Values))+geom_boxplot(aes(fill=Group))
输出

例2 :
# load ggplot2 package if already installed
library(ggplot2)

# create a data frame with two factors
df <- data.frame(Factor1=factor(rbinom(30, 1, 0.55),
                                label=c("male","female")),
                   Factor2=factor(rbinom(30, 1, 0.45),
                                  label=c("young","old")),
                   Values=rnorm(30,mean=5,sd=2))

# Now make a interaction between two factors
# on x axis
dfFactor1Factor2 <- interaction(dfFactor1, df$Factor2)

# now Plot Boxplot with fill color according
# to factor1 and factor2
ggplot(aes(y = Values, x = Factor1Factor2), data = df) +
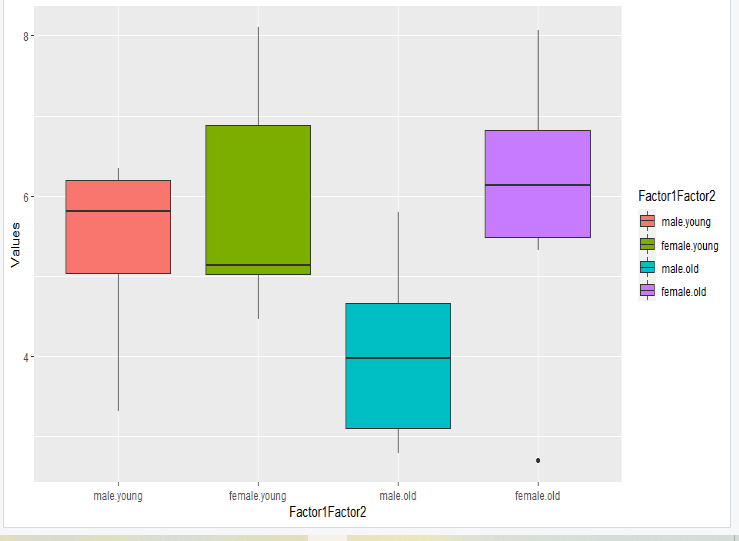
geom_boxplot(aes(fill=Factor1Factor2))
输出

 极客教程
极客教程