R语言 使用ggplot2创建多列值的博列表
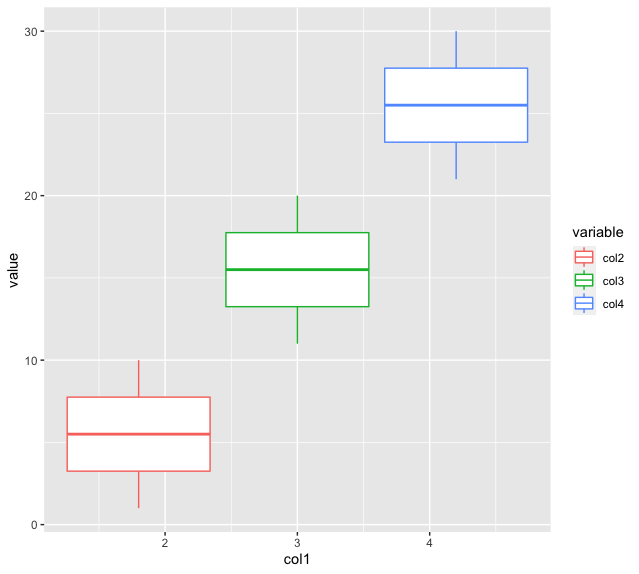
在这篇文章中,我们将讨论如何在R编程语言中使用ggplot2创建一个多列值的boxplot。
一个数据框架可以通过包含以行和列形式组织的值来创建。这些值可能属于不同的数据类型。reshape2软件包用于通过使用函数melt和cast来聚合数据。该库可以通过以下命令安装并加载到工作空间。
install.packages("reshape2")
R中的熔化方法用于熔化一个R对象,比如说一个数据框架,使之成为适合轻松铸造的形式。
语法:
melt(data, id.vars, measure.vars)
参数
- data – 要熔化的数据集
- id.vars – Id变量。
- measure.vars – 测量的变量。
本软件包中的ggplot方法用于声明和定义一个ggplot对象。它接受一个数据框架作为输入,并定义了一组拟用于绘图的审美映射。
ggplot(data = NULL, mapping = aes())
参数
- data – 在ggplot方法中作为输入的数据帧。
- mapping – 绘制时使用的美学映射的默认列表。
- 额外的组件可以被添加到ggplot对象中。geom_boxplot()方法用于在R中绘制一个boxplot()。
语法:
geom_boxplot( mapping = aes(x , y , color ))
例子 :
# importing required libraries
library(reshape2)
library(ggplot2)

# creating a dataframe
data_frame < - data.frame(col1=rep(1: 5, each=2),
                          col2=1: 10,
                          col3=11: 20,
                          col4=21: 30)

# creating the modified dataframe
data_mod < - melt(data_frame, id.vars='col1',
                  measure.vars=c('col2', 'col3', 'col4'))
# creating a plot
p < - ggplot(data_mod) +
geom_boxplot(aes(x=col1, y=value, color=variable))

# printing the plot
print(p)
输出

例子 2 :
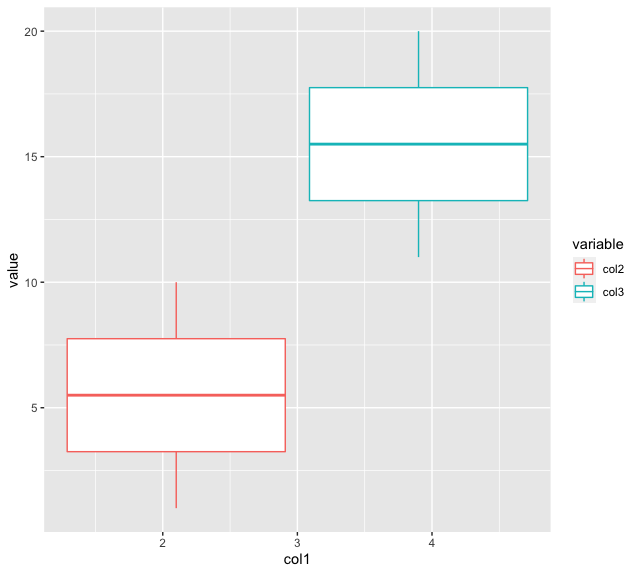
下面的代码片段说明了在x轴上绘制属于col2和col3的值,在y轴上绘制其相应的数据项。
library(reshape2)
library(ggplot2)

# creating a dataframe
data_frame < - data.frame(col1=rep(1: 5, each=2),
                          col2=1: 10,
                          col3=11: 20,
                          col4=21: 30)


# creating the modified dataframe
data_mod < - melt(data_frame, id.vars='col1',
                  measure.vars=c('col2', 'col3'))

# creating a plot
p < - ggplot(data_mod) +
geom_boxplot(aes(x=col1, y=value, color=variable))

# printing the plot
print(p)
输出

 极客教程
极客教程