R语言 给图添加文本 – text()和mtext()函数
文本被定义为一种描述与图形表示有关的数据的方式。它们作为标签在任何图画或图形表示中发挥作用。在这篇文章中,我们将学习通过使用 text() 和 mtext() 函数在R编程语言中为绘图添加文本。
R – text()函数
R编程语言中的text()函数用于在Base R中为绘图绘制文本元素。
语法: text(x, y, labels)
参数
- x和y: 数字值,指定要绘制的文本的坐标
- labels: 要写入的文本
返回: 添加到图中的文本
例子1 :
# R program to add text to plot

# Calling data set
d<-head(mtcars)

# Plotting the graph
plot(d[, 'wt'], d[, 'mpg'],
     main = " Car Weight vs. Milage ",
     xlab = "Miles", ylab = " Weight",
     pch = 19, col = "darkgreen")

# Calling text() function
text(d[, 'wt'], d[, 'mpg'],  row.names(d),
     cex = 0.88, pos = 2, col = "darkgreen")
输出

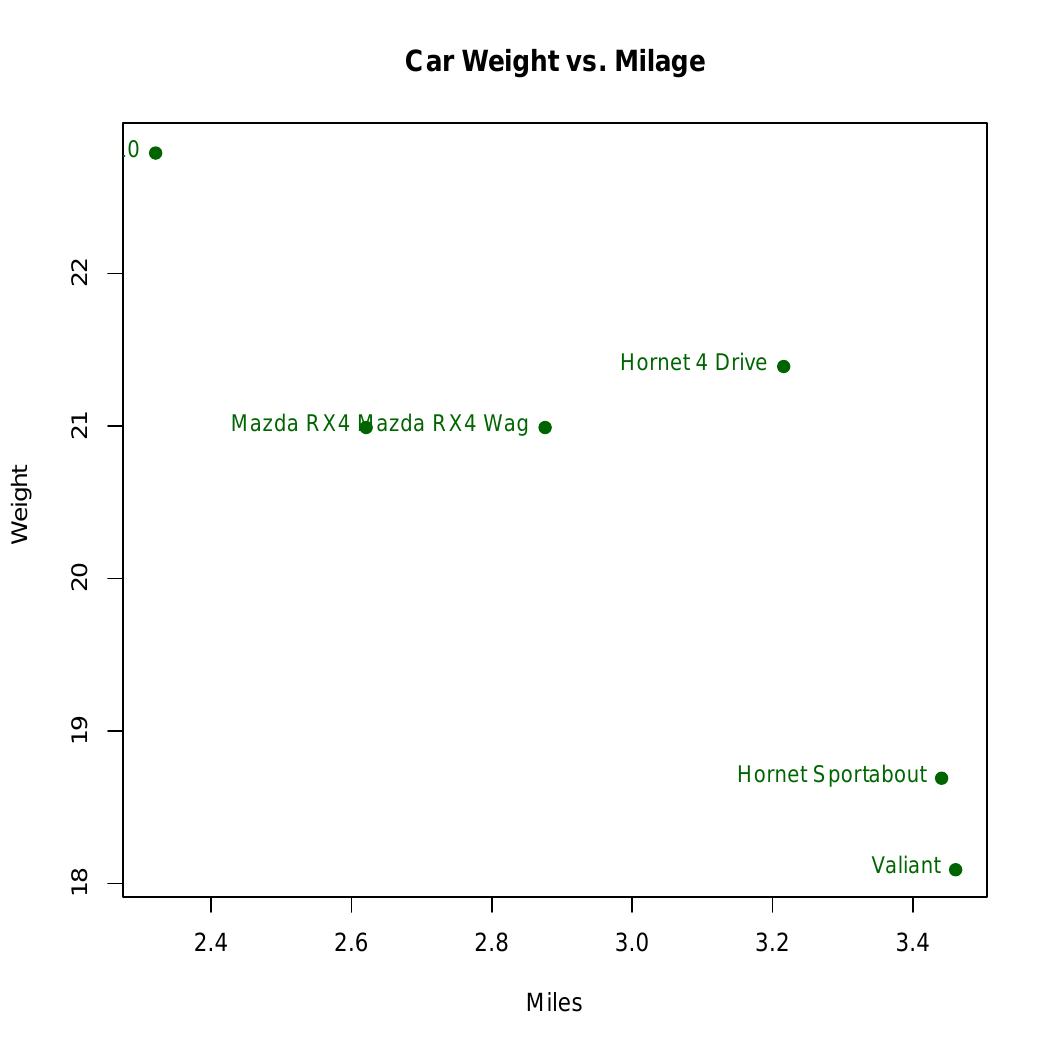
在上面的例子中,文本被添加到’mtcar’数据集的图中。
例2: 实现text(),在图中添加数学注释
# R program to add text to plot

# Plotting the graph
plot(1:5, 1:5,
     main = "text() Function  examples")

# Calling text() function
text(2, 3, expression(hat(beta) == (X^t * X)^{-1} * X^t * y))
text(3, 4, expression(bar(x) == sum(frac(x[i], n), i==1, n)))
输出

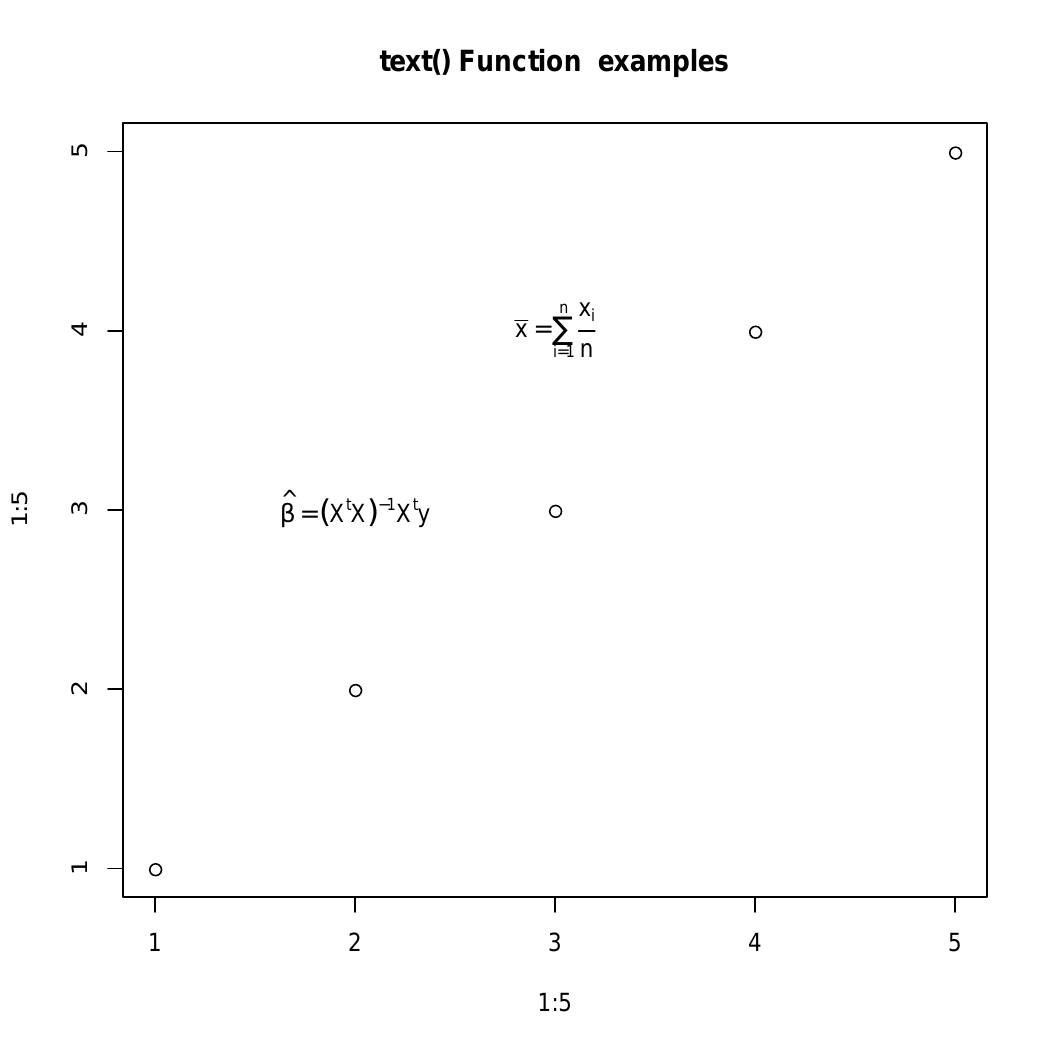
在上面的例子中, text() 函数被用来在图表中添加数学注释
R – mtext() 函数用于在图的边缘添加文本
R编程语言中的 mtext() 函数用于在图的空白处添加文本。
语法: mtext(text, side)
参数
- text: 要写入的文本
- side: 一个整数,指定绘图的边,如:底部、左侧、顶部和右侧。
返回: 在图形的空白处添加文本
例子
# R program to add text to a plot

# Creating a plot
plot(1:5, 1:5,
     main = "mtext examples")

# Calling mtext() function
mtext("mtext() function", side = 3)
输出

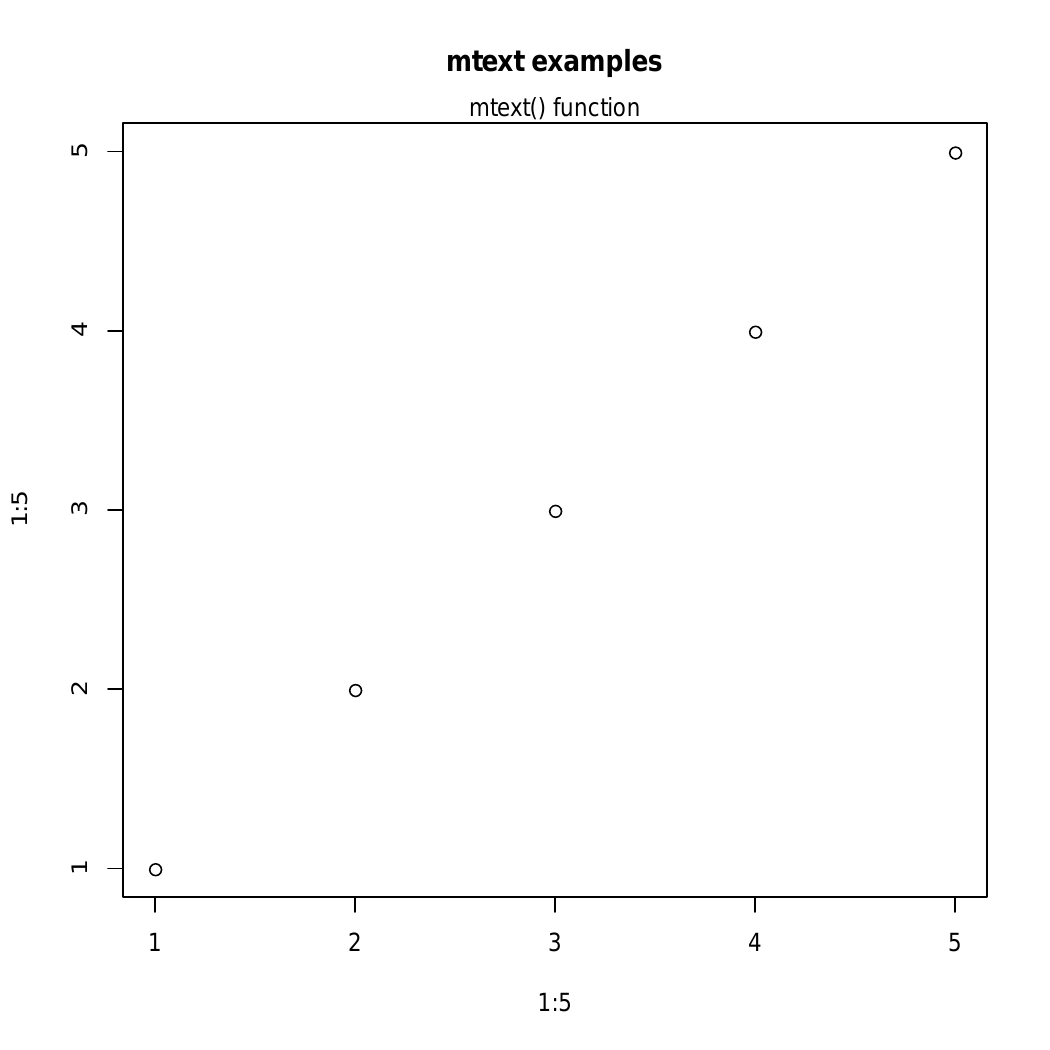
在这里,在上述例子中,side指定了绘图的侧面,如底部、左侧、顶部、右侧。而在给定的side=3中,即绘图的顶部部分。
 极客教程
极客教程