R语言 在ggplot的绘图区域内添加表格
在这篇文章中,我们将看到如何使用R编程语言中的ggplot2库在绘图区域内添加数据框表。
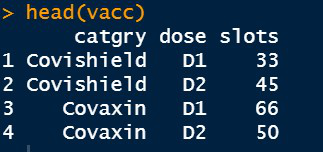
使用中的数据集

这里我们绘制的是一个散点图,同样的方法也可以用于任何其他图。为了在ggplot2中绘制散点图,我们使用函数 geom_point( ) 。
语法
geom_point(mapping=NULL, data=NULL, stat=”identity”, position=”identity”, …)
参数
- size : 指定点的大小。
- shape: 用于指定形状,ggplot2库有各种形状,其数值范围为[0,25]。
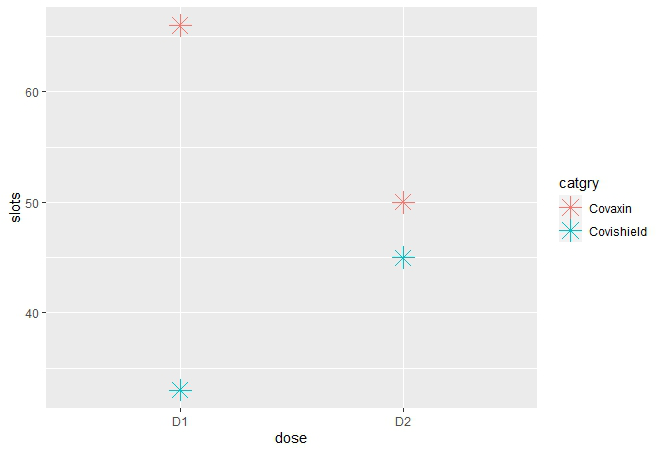
让我们先画一个没有表格的普通图,这样就能看出区别。
例子
library(ggplot2)

# Inserting data
vacc <- data.frame(catgry=rep(c("Covishield", "Covaxin"), each=2),
                   dose=rep(c("D1", "D2"),2),
                   slots=c(33, 45, 66, 50))

# To create ggplot2 scatter plot
plt <- ggplot(vacc, aes(dose, slots, color = catgry))+
  geom_point(shape=8,size = 5)

plt
输出

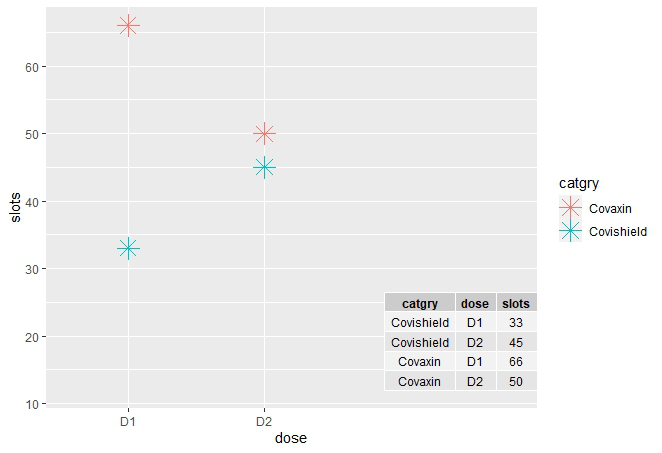
为了将表格添加到绘图中,我们首先使用 cbind() 创建表格 。 现在我们使用 annotate() 函数对表格进行注释 。 它被用来指定表格在ggplot中的位置。
语法
annotate(geom,x,y,xmin,xmax,ymin,ymax, label,vjust,hjust,....)
参数 :
- geom : 这里要做注释的表格中的几何体名称
- x,y,xmax,ymax,xmin,ymin : 必须提到其中的任何两个,以设置表格在绘图中的位置。
- label : Label是指我们要添加到绘图区域中的ggp_table。
- vjust, hjust : 设置表格的水平和垂直调整。
在进行下一步之前,我们需要安装并加载R中另一个名为 ggpmisc 的库,它代表ggplot的杂项扩展。为了安装和加载,在R控制台中写下以下命令。
install.packages(“ggpmisc”)
library(ggpmisc)
这个库有助于在绘图区域中使用关键字 :
geom="table" //在注释函数中使用
例子
library(ggplot2)
library(ggpmisc)

# Inserting data
vacc <- data.frame(catgry=rep(c("Covishield", "Covaxin"), each=2),
                   dose=rep(c("D1", "D2"),2),
                   slots=c(33, 45, 66, 50))
head(vacc)

# To create ggplot2 scatter plot
ggplot(vacc, aes(dose, slots, color = catgry))+
geom_point(shape=8,size = 5)+ annotate(geom = "table",x = 4,y = 12,
                                       label = list(cbind(vacc)))
输出

 极客教程
极客教程