R语言 如何使用上标与ggplot2
在这篇文章中,我们将看到如何在R编程语言中使用上标与ggplot2。你可以在绘图的任何地方使用上标。在所有地方使用上标值,其功能将保持不变。这里我们将在ggplot2的标题和轴的标签处使用上标值。
为此,使用library()函数加载第一个ggplot2包。
使用中的数据
| 编号 | X | Y |
|---|---|---|
| 1 | 1 | 1 |
| 2 | 2 | 4 |
| 3 | 3 | 9 |
| 4 | 4 | 16 |
| 5 | 5 | 25 |
| 6 | 6 | 36 |
| 7 | 7 | 49 |
| 8 | 8 | 64 |
| 9 | 9 | 81 |
| 10 | 10 | 100 |
为了制作R图,我们使用 ggplot() 函数,为了制作线图,在ggplot()函数中添加 geom_line() 函数。让我们首先有规律地绘制,这样就可以看出差异。
例子
# Load Package
library("ggplot2")

# Create a DataFrame
DF <- data.frame(X = c(1, 2, 3, 4, 5, 6, 7,
                       8, 9, 10),

                 Y = c(1, 4, 9, 16, 25, 36,
                       49, 64, 81, 100))

# Create a LineGraph
ggplot(DF,aes(X, Y))+
  geom_line(size = 2, color = "green")
输出

简单的线形图
在图轴的标签上加标
这里使用 bquote() 函数 来产生一个上标标签。
语法: bquote(expr)
参数 :
- expr: 语言对象
bquote() 用于SuperScript。
bquote('string'(math superscript Notation))
为了给X轴和Y轴分配标签,我们将使用 xlab() 和 ylab() 函数,分别给X轴和Y轴分配标签。
语法: xlab(“X-轴的标签”)
语法 : ylab(“Y-轴的标签”)
例子
# Load ggplot2 Package
library("ggplot2")

# Create a DataFrame For Plotting
DF <- data.frame(X = c(1, 2, 3, 4, 5, 6,
                       7, 8, 9, 10),

                 Y = c(1, 4, 9, 16, 25, 36,
                       49, 64, 81, 100))

# Create ggplot2 Line Graph with
# SuperScripted value of Label of
# Y Axis.
ggplot(DF,aes(X, Y))+
  geom_line(size = 2, color = "green")+
  xlab('X-axis (number)')+
  ylab(bquote('Y-axis '(number^2)))
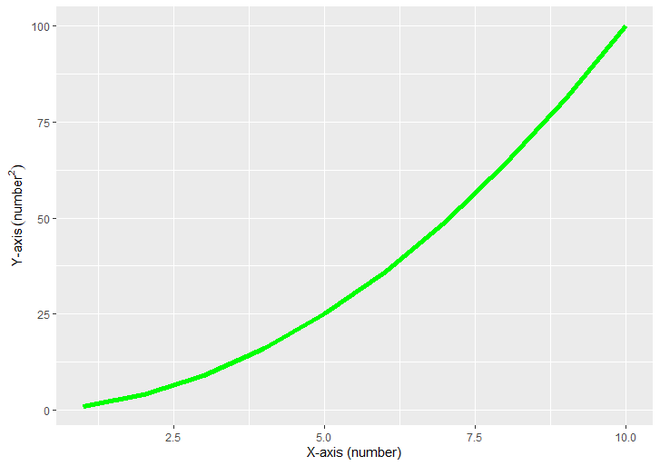
输出

带有Y轴上标标签的ggplot2绘图
对绘图标题进行上标
要添加上标作为标题,请在ggtitle()中添加带值的bquote函数。
语法: ggtitle(“绘图的标题”)
参数:
- 像xlab和ylab函数一样,我们可以直接用这个函数给图的标题。这里我们用bquote()函数来写上标值(数字VS数字2 )作为图的标题。
返回: 绘图的标题。
例子
# Load ggplot2 Package
library("ggplot2")

# Create a DataFrame For Plotting
DF <- data.frame(X = c(1, 2, 3, 4, 5, 6,
                       7, 8, 9, 10),

                 Y = c(1, 4, 9, 16, 25, 36,
                       49, 64, 81, 100))

# Create ggplot2 Line Graph with SuperScripted
# value of Title of plot
ggplot(DF,aes(X, Y))+
  geom_line(size = 2, color = "green")+
  ggtitle(bquote('Number VS'~Number^2))
输出

带有上标Title的ggplot2绘图
 极客教程
极客教程