R语言 如何叠加绘图
在这篇文章中,我们将讨论如何在R编程语言中叠加绘图。
叠加是一种技术,用于在一个框架上绘制多个图。为了在R语言中绘制多个图,我们绘制一个基本图,并通过使用lines()和point()函数添加一个重叠的线图或散点图。这种线图和散点图的叠加可以在R语言的任何图层上绘制。
方法1:在R语言中叠加线状图
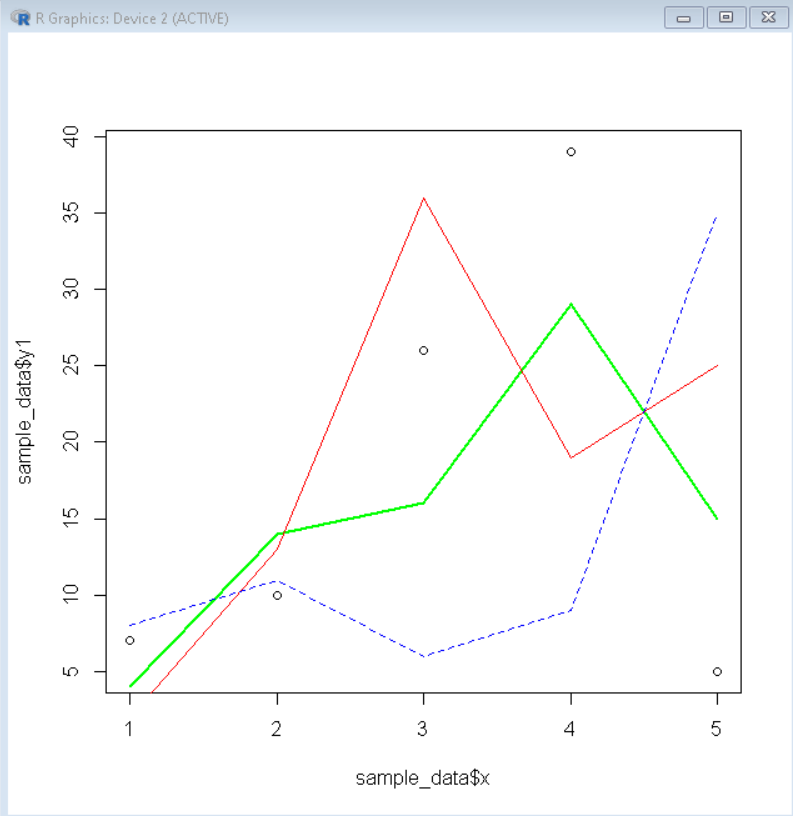
为了在R语言中叠加线图,我们使用lines()函数。lines()函数是一个通用函数,它通过从数据框中获取坐标并将相应的点用线段连接起来来叠加线段图。我们可以通过使用lty、lwd和col参数来进一步定制线型图,分别定制线型、线宽和线色。
语法
points( x, y, ltype, lwd, col )
参数
- x和y: 分别决定x轴和y轴的变量。
- lty: 决定线的类型。
- lwd :决定线的宽度。
- col: 决定线的颜色。
例子: 叠加线图
# define sample data frames
sample_data <- data.frame(x=c(1, 2, 3, 4, 5),
                  y1 = c(7, 10, 26, 39, 5),
                  y2 = c(4, 14, 16, 29, 15),
                  y3 = c(2, 13, 36, 19, 25),
                  y4 = c(8, 11, 6, 9, 35))


# create base scatter plot
plot(sample_datax, sample_datay1)

# overlay line plot
lines(sample_datax, sample_datay2, col='green', lwd=2)
lines(sample_datax, sample_datay3, col='red', lwd=1)
lines(sample_datax, sample_datay4, col='blue', lty="dashed")
输出

方法2:在R语言中叠加散点图
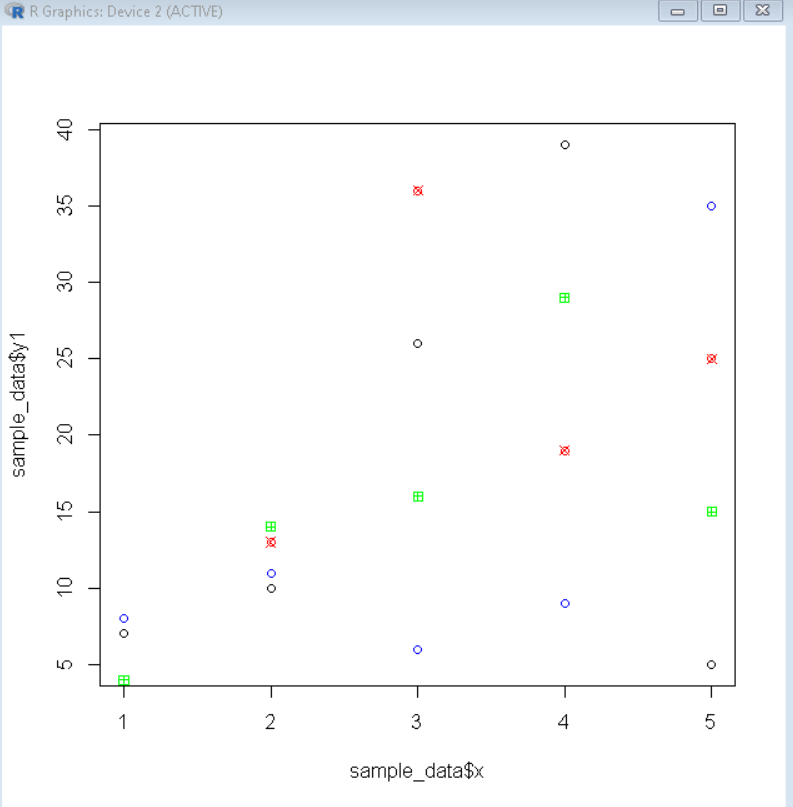
为了在R语言中叠加散点图,我们使用point()函数。points()函数是一个通用函数,它通过从数据框架中获取坐标并绘制相应的点来叠加散点图。我们可以通过使用pch和col参数进一步定制散点图,以分别定制点的形状和点的颜色。
语法
points( x, y, pch, col )
参数
- x和y: 分别决定x轴和y轴的变量。
- pch: 确定点的形状。
- col: 决定点的颜色。
例子: 叠加散点图
# define sample data frames
sample_data <- data.frame(x=c(1, 2, 3, 4, 5),
                  y1 = c(7, 10, 26, 39, 5),
                  y2 = c(4, 14, 16, 29, 15),
                  y3 = c(2, 13, 36, 19, 25),
                  y4 = c(8, 11, 6, 9, 35))


# create base scatter plot
plot(sample_datax, sample_datay1)

# overlay scatter plot
points(sample_datax, sample_datay2, col='green', pch=12)
points(sample_datax, sample_datay3, col='red', pch=13)
points(sample_datax, sample_datay4, col='blue')
输出

 极客教程
极客教程